
Sourcedemo is a program that helps visualize electric fields and interference patterns from two sources. It allows two sources (either spherical or plane waves) to be positioned on a plane. In intensity mode, the interference between the two sources is displayed. In e-field mode, a stationary "snapshot" of the otherwise oscillating electric field is drawn (with middle gray being zero). Either source can be turned off, varied in intensity, or varied in initial phase.
The following picture shows sourcedemo as it appears when the program starts:
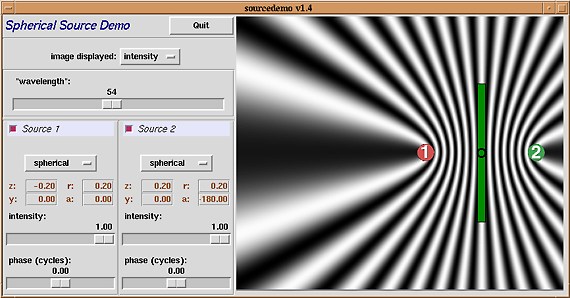
The image on the right shows either the e-field or the intensity of the light in the region near two sources. The position of the sources themselves is indicated by the two circles. The circles can be moved by placing the mouse pointer over them, clicking on them and dragging them to a new location. (Note that the e-field or intensity pattern does not update until the mouse button is release, since updates may take up to a second on some computers.) The green rectangle represents a photosensitive plate or surface: it provides a reverence area in the image. The circle at the center of the plate represents the origin of the image. Plane waves from either source point from the source position to the origin.
Two boxes on the left of the window control the parameters of each source. At the top of each box is the name of the source, either "Source 1" or "Source 2." This title is also a button. Clicking on the title turns a source on or off. If the source is on, a small red box appears next to the title.
Below the title is an option menu that controls the shape of the source wavefront. Initially, the shape of each source is spherical (or, in the two dimensions of the plane, circular). The center of the sources is located at the given point in the diagram. The sources can be changed to be plane waves. If this option is chosen, the position of the points in the diagram set only the angle of the plane wave (as referenced from the origin).
Below the source shape option menu are four boxes that indicate the position of the source in the diagram. "Y" and "Z" indicate the vertical and horizontal positions of the points, respectively, while "R" and "A" give the same information in polar coordinates.
Below the coordinate window are two sliders that control the brightness and phase of the two sources. The intensity slider controls the brightness of a source; its value is in a normalized unit. The phase slider alters the initial phase a source (relative to the other source). The value of the phase slider is measured in cycles, so changing the value from its default 0 to 0.5 advances the phase of the point by half a cycle.
Dragging one slider changes the phase or intensity of a given source. Holding down the "Shift" key while dragging changes the values of both sliders at once.
Above the source control boxes is a control that changes the wavelength of the light from the sources. In fact, the wavelength used in this demonstration is very much longer than the wavelength of light in order to show detail of the wavefronts. The control does, however, give some sense of the change in the pattern of interference over the range of visible wavelengths of light.
The option menu above the wavelength slider controls whether intensity (the interference pattern) or e-field (related to the phase of light from the sources) is displayed. Once again, the "e-field" image is only a snapshot of the oscillation over time. The intensity image, however, is constant and unvarying (assuming the sources are mutually coherent).
Both sources spherical, pattern set to intensity. This setting shows how a stationary interference pattern is formed in space from two spherical sources. Note what happens when you adjust both phase sliders by the same amount (hold down "Shift" while dragging a phase slider).
One source on, pattern set to e-field. This setting allows you to see the "e-field footprint" of a source. Be aware that the e-field is an oscillation: the image that you see is a snapshot of that oscillation in time.
Both sources on, pattern set to e-field. This complex pattern is the sum of the two source e-fields. Areas of low intensity in the intensity image must be gray in this e-field image. However, "zero crossings" of oscillating sinusoids in the traveling e-field are also gray. Try varying both phases at the same time (shift-click) while looking at the combined e-field image and see if you can distinguish between the two areas with "zero gray" values.
Both sources planar, pattern set to intensity. The interference pattern consists of a series of light and dark lines. Note that a line of this pattern can be drawn from the origin to the middle of the line that connects the two point sources.
Both sources spherical and in-line, both on the same side of the plate, pointing towards the origin, pattern set to intensity. The interference pattern is symmetric around a line that joins the sources. Imagine what a three-dimensional interference pattern would look like. What would the two-dimensional intersection of the pattern and a 2D photosensitive plate located at the green rectangle look like?
Both sources spherical, on the same side of the plate, equidistant from the origin, pattern set to intensity. At a sufficiently large distance from the plate, spherical sources start to look more and more like plane waves, and spacing of the fringes of the interference pattern at the surface of the plate is more or less linear.
One source intensity set to 1.0, the other to about 0.01. Look at both the e-field and the intensity pattern with these two source settings. In which does a weak source have the most influence?