Gaussian X,Y Results Final Project MAS622J, Fall 2004
X,Y Feature
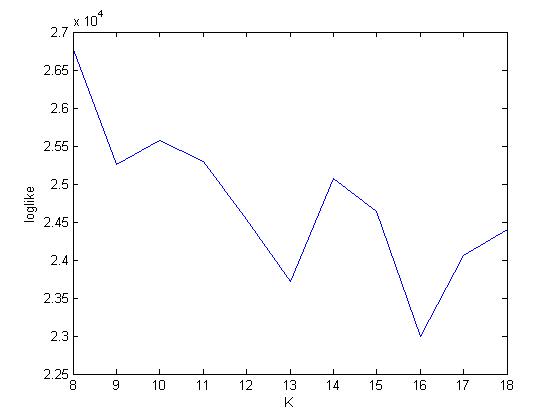
Graph of Log Likelihood vs. K Optimal K = 8 Test Accuracy = 37%
Graph of Log Likelihood vs. K
Optimal K = 8
Test Accuracy = 37%