presentation slides: [ppt] [pdf]
The project surrounded building a system called distinctive touch for enabling lightweight authentication using gestures on touchscreen displays. Using this system, users were identified by their passdoodle, a gestural equivalent of a username and password, which consisted of one or more strokes that they drew on the screen with their finger within a short duration of time. The first time they used a kiosk, users each chose their own unique passdoodles, and trained the system by demonstrating this doodle sseveral times. Their passdoodle then uniquely identified them on subsequent visits to the kiosk. This could be used for kiosk applications to provide users access to personalized content and services, such as content filtering, or messaging. Unlike biometric or RFID-based schemes, distincitve touch protected user privacy by being entirely anonymous and user-initiated.
This project extending prior work done by Dean Rubine, described in his SIGGRAPH '93 paper "Specifying Gesture by Example", in which he outlined a system for learning unistroke gestures called GRANDMA. GRANDMA consisted of a simple linear classifier which used 13 feature extractors that measured geometric and timing properties of each gesture.
Distinctive touch extended this work in the following ways:
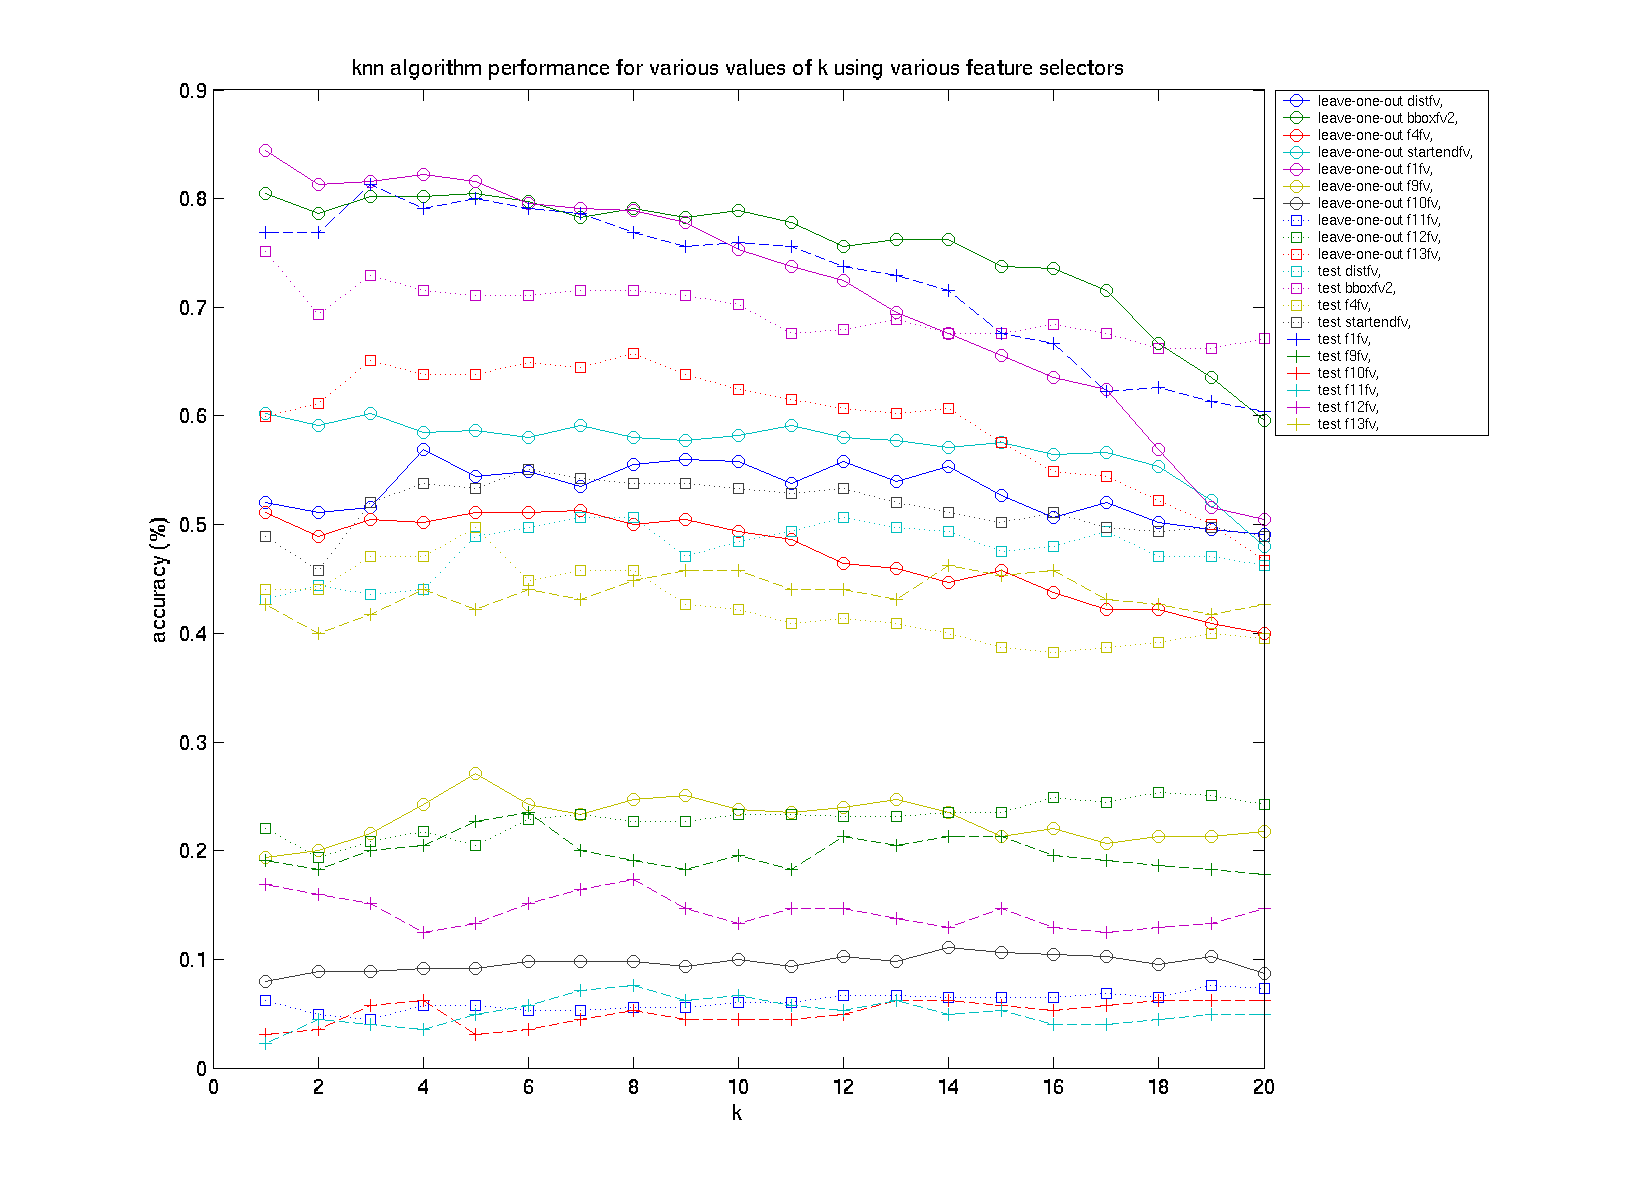
Recognition results using a combination of all 10 dt (13 rubine) feature extractors are shown in the following figure:
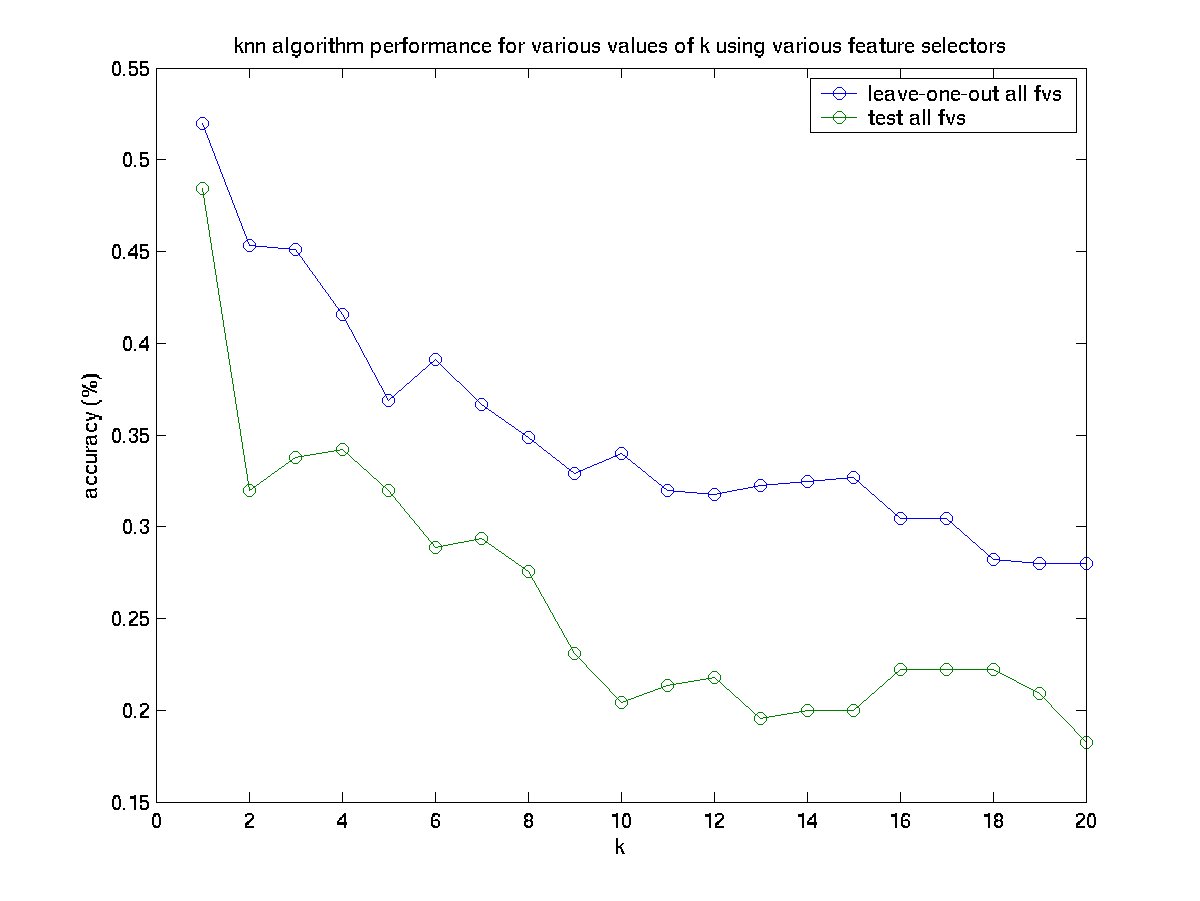
Maximum performance for all features combined classifier: LOO-CV: 52.0%, Test: 48.00%.
Here, we witness the phenomenon that adding features, in the case of knn, can reduce the overall performance. The change in performance was to be expected, since the addition of the extra features increases the dimensionality of the space dramatically, which causes distances between previously close neighbors to be much larger.
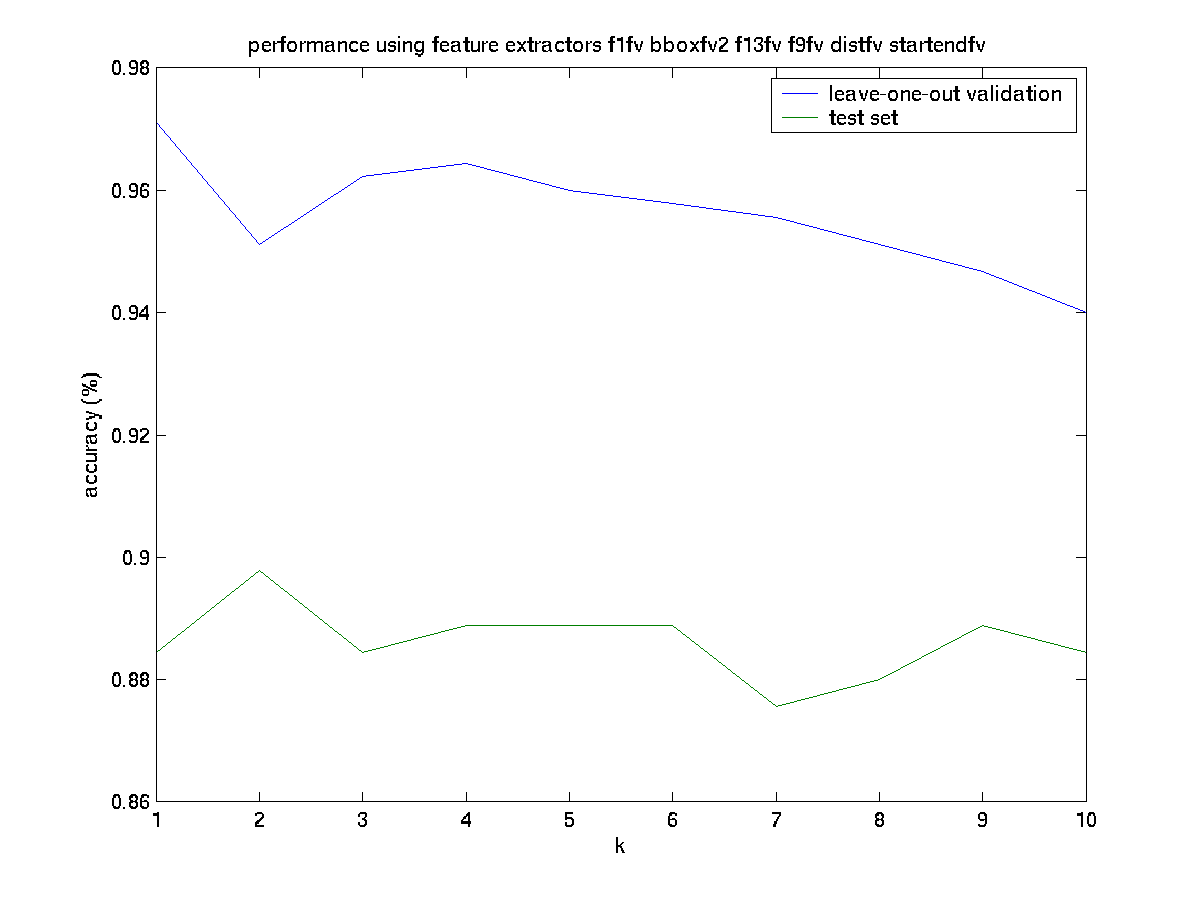
Maximum cross-validation performance was obtained with the combination of extractors f1fv,
bboxfv2,f13fv,f9fv,distfv,startendfv, at k=1. Performance
with these parameters were as follows: LOO-CV: 97.11%, Test: 88.44%.
fisher linear discriminant
The chosen implementation for FLD was a standard 1-dimensional binary discriminant that maximized
the separability of 2 classes by projecting N-dimensional points onto a single optimal vector.
Each test point projected on this vector was classified according to the optimal bayes
decision boundary between the projected means of the two classes. Since FLDs are binary
discriminants, a One-Versus-All approach was taken to achive multiclass classification.
This involved finding C=45 different FLDs (one for each class). For each of these FLDs,
all the training data that belonged to that class were assigned to one class, while
all the other training data were lumped into another class. Performance was
evaluated by taking the ratio between correct labellings with total evaluations.
As will be described in rejection this measure of performance
is somewhat misleading, and will be avoided in the future.
| feature extractor | leave-one-out performance | test performance |
| distfv | 0.9422 | 0.8311 |
| bboxfv2 | 0.9356 | 0.8711 |
| f4fv | 0.8444 | 0.7556 |
| startendfv | 0.9600 | 0.880 |
| f1fv | 0.9244 | 0.9022 |
| f9fv | 0.8711 | 0.7644 |
| f10fv | 0.8467 | 0.5778 |
| f11fv | 0.7867 | 0.5556 |
| f12fv | 0.8467 | 0.7067 |
| f13fv | 0.9333 | 0.8400 |
Furthermore, the two highest-performing test-validation scores for a combination of 3 and 5 feature extractors with FLD are displayed in the following tables, respectively.
| feature extractor | leave-one-out performance | test performance |
| bboxfv2, f12fv, startendfv | 0.9822 | 0.8489 |
| f1fv, f9fv, startendfv | 0.9533 | 0.9733 |
| feature extractor | leave-one-out performance | test performance |
| f1fv, f12fv, distfv, startendfv, bboxfv2 | 0.9867 | 0.9156 |
| f1fv, f9fv, f11fv, distfv, startendfv, | 0.9778 | 0.9644 |
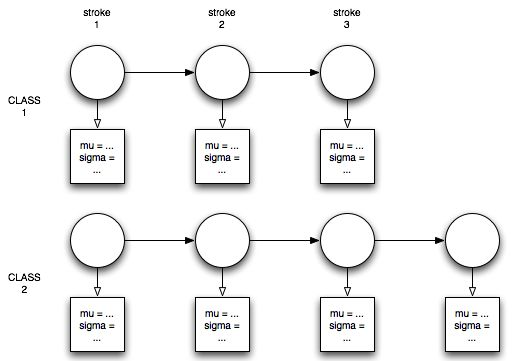
This approach involved making a model for each class using the labeled training data, where each model consisted of a sequence of states each corresponding to a single stroke in the gesture. Each state had an associated parametric probability distribution. The parameters for a model were then estimated by maximum-likelihood (ML) on a per-stroke basis using the training data for each class.
The reason for choosing this over an HMM is the following: given the initial assumption that the stroke order would have to be preserved for a gesture to be considered part of a single class, if states represnted entire strokes themselves, the state sequence for a class would be completely known a-priori.
For simplicity, I chose a single gaussian, which made estimating the gaussian parameters for each stroke trivially computed as the mean and covariance of the data in that class. Then, computing the probability that an example belongs to a particular model involved merely taking the product of the probabilities that a stroke sequence resulted from a particular model using the estimated parameters at each state in each model. If a model had different number of strokes than were observed, that model is automatically rejected.
While the stength of this model lies in the simplicity with which estimation can be performed, it is not without limitations. One difficulty arises in the strictness with which the model assumes that all training examples have exactly the same number of strokes and in the right order. Spurious strokes will completely throw classification and training off. Second, although it is simple to compute the likelihoods, it is unclear, given a set of likelihoods, how the algorithm should choose determine which class it belongs to. Choosing the maximum posterior likelihood (as a linear machine) would mean that the system acts "greedily" and never rejects a passdoodle. Depending on the application and installation and preferred failure mode, this property may or may not be desirable. For interactive touchscreen displays in small (trusted) workgroups, such as for A/V systems in workgroup conference rooms, for example, choosing the best match might be the right thing to do. On the other hand, if information or privileges being protected were sensitive, it would be more appropriate to have a scheme that rejects passdoodles below a certain threshhold likelihood. This is discussed further in rejection.
| feature extractor | leave-one-out performance | test performance |
| distfv | 0.5422 | 0.3467 |
| bboxfv2 | 0.8067 | 0.6756 |
| f4fv | 0.5156 | 0.4267 |
| startendfv | 0.6067 | 0.4400 |
| f1fv | 0.8889 | 0.7511 |
| f9fv | 0.6511 | 0.5822 |
| f10fv | 0.5467 | 0.4222 |
| f11fv | 0.4311 | 0.3333 |
| f12fv | 0.2756 | 0.1289 |
| f13fv | 0.6378 | 0.4178 |
The following table displays the leave-one-out and test performance of the best performing combinations 3, 4 feature extractors out of 10, compared with the performance of all 10 combined.
| feature extractor | leave-one-out performance | test performance |
| f9fv, bboxfv2, startendfv | 0.9733 | 0.9156 |
| f1fv, startendfv, f9fv, distfv | 0.9644 | 0.8889 |
| f1fv, f9fv, f11fv, distfv, startendfv, | 0.9778 | 0.9644 |
| all combined: distfv, bboxfv2, f4fv, startendfv, f1fv, f9fv, f10fv, f11fv, f12fv, f13fv | 0.9711 | 0.8800 |
In practice, training SVMs over and over for leave-one-out validation took far too long. Therefore, I have omitted reporting loo-validation results here, and merely report test results.
| feature extractor | linear kernel test performance | quadratic kernel test performance |
| distfv | 0.9790 | 0.979 |
| bboxfv2 | 0.9789 | 0.9789 |
| f4fv | 0.9784 | 0.9784 |
| startendfv | 0.9778 | 0.9778 |
| f1fv | 0.9831 | 0.9831 |
| f9fv | 0.9778 | 0.9778 |
| f10fv | 0.9778 | 0.9778 |
| f11fv | 0.9778 | 0.9778 |
| f12fv | 0.9774 | 0.9775 |
| f13fv | 0.9778 | 0.9778 |
| all combined: distfv, bboxfv2, f4fv, startendfv, f1fv, f9fv, f10fv, f11fv, f12fv, f13fv |
0.9923 | 0.9923 |
In order to modify these algorithms to be able to reject gestures, they will each have to be given thresholds which represent the "maximum dissimilarity with any class" to tolerate. Then, these algorithms can be made to reject any gestures that are more dissimilar than this quantity. In k-nearest-neighbors, this threshold would be a maximal "distance" value, whereas with sequential ML it would be represented as a minimum log probability. In practice, however, coming up with such threshold values is tricky. In particular, since the variance of data for each class will differ, this maximum dissimilarity may depend on the variance of the data in the class. It may be feasible to use the Mahalanoubis distance, however, I have not tested how well this performs.
The FLD and SVM classifiers, however, may reject gestures as-is; however, it becomes difficult to gain a sense during the training process of exactly how liberal these classifiers will be even among the training set. In order get a slightly better sense, the SVM classifiers were re-evaluated using different performance criteria than was used previously. In this scheme, a classification is considered correct only if all C=45 classifiers (SVMs) output the proper labels. That is, a score of 1 is assigned for every trial gesture in a test set, if exactly 1 SVM classifier corresponding to the actual class of the gesture accepts it, and all the remaining classifiers reject it. The performance with this new criteria are outlined below.
| feature extractor | linear kernel | quadratic kernel | cubic kernel | quartic kernel |
| all combined: distfv, bboxfv2, f4fv, startendfv, f1fv, f9fv, f10fv, f11fv, f12fv, f13fv |
0.6978 | 0.6222 | no data | no data |
| f1fv, f9fv, bboxfv2, distfv, startendfv | 0.7244 | 0.8444 | 0.8311 | 0.7867 |
| f1fv, f9fv, f11fv, bboxfv2, distfv | 0.6489 | 0.8400 | 0.8000 | 0.7511 |
An alternative might be to use thesholds on log likelihoods from the SVMs, or distances from the margin in the FLD to reject gestures.
[ back to top ]