goal  |  mapping  |  listening experiment  |  analysis  |  system  | download:  slides  |  data

experiment preparation

Preparation of music clips:

• Five pieces were composed, ranging from jazz, rock to electronic music. Music genre remained constant within each matrix.
• Tempos remained constant in each matrix, but overall tempi varied between 90-120 BPM.
• For each piece, looping audio segments were produced to reflect the layer/complexity map.
• Segments were arranged into a 4x4 matrix for each piece.
• For each piece, four clips were assembled by traversing the matrix as follows:

1) Increasing complexity
2) Increasing instrument layering
3) Decrease complexity
4) Decrease instrument layering

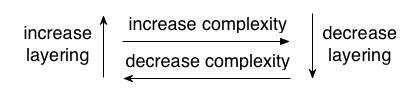
Traversing the Music Matrix

13. complexity=1 layers=4 14. complexity=2 layers=4 15. complexity=3 layers=4 16. complexity=4 layers=4
9. complexity=1 layers=3 10. complexity=2 layers=3 11. complexity=3 layers=3 12. complexity=4 layers=3
5. complexity=1 layers=2 6. complexity=2 layers=2 7. complexity=3 layers=2 8. complexity=4 layers=2
1. complexity=1 layers=1 2. complexity=2 layers=1 3. complexity=3 layers=1 4. complexity=4 layers=1
Matrix Example (genre: jazz; 90 BPM)

Four sets of progresssions (one in each direction) were selected from the five matrices, resulting in 20 clips. Progressions were chosen based on the clarity with which they demonstrated motion in the specified direction. All possible progressions within each matrix were considered.

Preparation for data collection:

Physiological data:
• Galvactivator set up to measure GSR
• microphone connected to measure presence of foot-tapping
Self-report data:
• dual 7-point scales were set up for subject's affective response self-report
• two sets were prepared for subjects to report their initial and final reactions


Listening experiment self-report for one music clip

conducting the experiment

Experiment details:
• 8 participants: 6 male, 2 female
• 20 audio clips (25-45 seconds each) were played for each subject
• experiment lasted approximately 25 minutes

Data collected:
• GSR was sampled every second throughout entire listening,
• BPM and velocity of foot-tapping was sampled every second, and presence of foot-tapping was sampled every 2 seconds
• subject self-reported affective response twice during each clip (initial & final)

Notes:
• Foot-tapping: Subjects were instructed to tap their foot naturally as they felt a connection to the music. A wooden platform was provided for subjects to tap their feet. A microphone was attached to the platform, and its output sent to a computer. The computer analyzed the input signal using a beat tracker programmed in MAX/MSP.
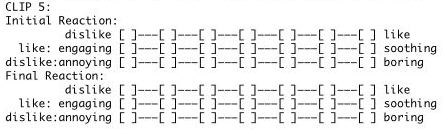
• Self-report: A self-report form was provided to each subject to rate their initial and final reactions to each matrix progression. Subjects were asked to provide their initial reaction as soon as the music clip began, and their reaction again as the clip ended. Subjects first rated how much they disliked or liked the music, along a 7-point scale. Subjects gave an additional 7-point rating that depended on their valence reaction. For a positive reaction, the choice ranged from engaging to soothing. For negative, the choice ranged from annoying to boring. Results of each reaction in the survey were mapped to integers from -3 to +3, where a value of 0 corresponds to no reaction. Results from the dislike/like rating was mapped to the x-axis, while results of the engaging/soothing or annoying/boring ratings were mapped to the y-axis. The distance between initial and final reactions were stored as vectors.