Affective Photography
Introduction
The aim of the project is to explore the possibility of using data from a physiological sensor to annotate, filter and browse photographs.
The original idea includes a digital camera and photo display augmented with an affect sensor. Every time a picture is taken, the camera reads from the sensors and stores the data with the image. The sensor data associated with each image is then used within the display system to determine which photos to show: only photos with associated data matching the current state of the viewer are visualized. In other words the system is designed to allow browsing the images based on the current affective state of the viewers, creating a sort of "affective photo diary".
Assuming that a large collection of photos and associated sensor data samples is available, the system described should allow users to explore the continuity of affect and of those affective states which can be hard to describe in words, but that can be understood by recalling (with the help of the automatically displayed photos) memories of other situations in which they occurred. The system also aims at providing a novel way of filtering and indexing images.
Related Work
A number of other systems have been reported about the use of sensors to augment photo cameras.
StartleCam is a wearable camera which is triggered every time a startle reaction is detected in the galvanic skin response of the user.
In SenseCam a wearable camera is augmented with accelerometers, passive IR sensor, visible light sensor and temperature sensor. A photo is taken every time an event is detected by one of the sensors, such as a person passing by or a sudden light level change. SenseCam also continuously records the sensor data, and the stored data can then be transferred to a PC and browsed based on time.
The project was also partially inspired by the "Mile Markers" project, an art project in which a photograph was automatically taken at every mile on a coast to coast road trip (the camera was controlled by the car odometer).
Compared to other systems that involve photography and affective computing such as StartleCam or SenseCam, the approach proposed here is different in at least two major ways. First, it leaves to the photographer the decision of the shoot (and hence the shoot composition): taking a photograph is a way of selecting and isolating a subject and an instant in time. Second, the focus in this project is on the continuity (in mathematical sense) of affective signals, while StartleCam and SenseCam try to find patterns in the signals that identify events (such as the startle reaction).
Implementation
The Affective Photography system is composed of two separate parts: camera and display, both augmented with the same physiological sensor. In general different types of sensors could be used, even multiple ones at the same time. In this project, however, the choice was for the "HandWave": a wireless GSR sensor by Carson Reynolds and others. The HandWave streams the acquired GSR data via a serial connection over Bluetooth (RFCOMM protocol). Simple electrodes were constructed using conductive tape (about 4 cm2 in size), as shown in figure 2.
Camera
The camera or "recording system" was implemented on a Series 60 mobile phone equipped with a digital camera and Bluetooth radio. The choice was driven by the fact that compared to most digital cameras this type of phones is more easily programmable and include the Bluetooth capabilities.
A software module (class) was created for the phone to connect to the HandWave device and record the streamed data in a circular buffer fitting about 10 seconds of data. The content of the buffer can be at any time saved to a file on the phone. The data files on the phone can later be transferred to a PC for processing and analysis.
The source code for the acquisition module can be found here. A GUI application to interactively record data was also implemented and it is available with its source here.
To implement the affective photography application one of the camera examples available on the Nokia website was modified to acquire data from the Bluetooth sensor and save it every time a photo is taken. The Nokia example code is not re-distributable but can be found here, while the additions can be found in this diff file.
Display
The display part of the system was implemented on a PC under Linux.
A framework was built in C++ for the signal acquisition and processing, and for interfacing with a GUI application.
The signal is acquired from the Bluetooth serial connection, converted (from the native HandWave format to micro siemens) and stored in a circular buffer. Every time N new samples are ready, the last k*N samples are passed to a data processing function (implementing a "sliding window" behaviour). Values for k and N can be arbitrarily set in the framework. The processing function can be running in the same thread of execution of the acquisition routine or in a separate one. The results of the processing module are made available to the application, which runs in a separate thread. The acquired signal can also be displayed in a window for debug.
The framework was designed to be flexible and be usable with different types of sensors and applications. For the AP project a simple photo display application was implemented to display one of a number of stored images according to the result of the processing of the current data frame. As illustrated in Figure 1, together with each photo a plot of the associated waveform is displayed.
The source code for the framework and the photo display application can be found here. The program relies on Gtkmm, as well as a Bluetooth stack implementation for Linux, such as blueZ.
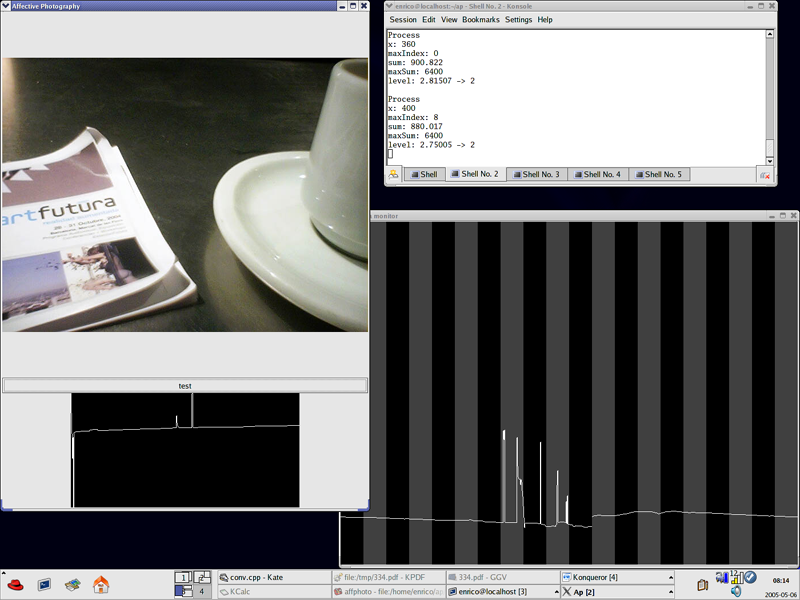
Figure 1. A screen shot of the display system. Each of the bars in the signal plot (bottom right) represents a block of N samples. Other screen shots are available here.
Experiments and Discussion
To test the basic functionality of the display system and demonstrate the application concept a simple experiment was carried out where each of ten images was assigned to a different level of arousal and the signal acquired from the sensor was used to browse them. The current value of the moving average of the GSR signal determined which photo is displayed (at any time).
The system on the phone allows to record data in a mobile context. The electrodes were mounted on the HandWave device as shown in Figure 1, this simulates the electrodes position on a mobile phone when taking a picture. The control application described above was used on the phone (hold in the other hand) to determine when to record the data.
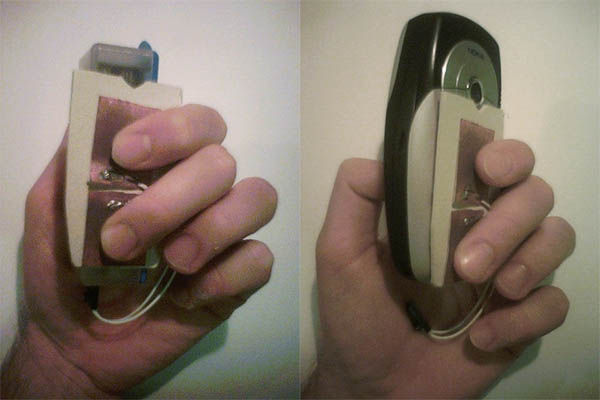
Figure 2. Electrodes mounted on the HandWave device (left) and on a mobile phone (right).
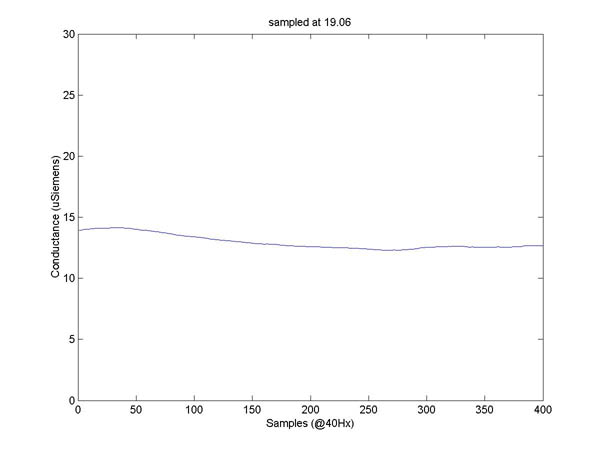
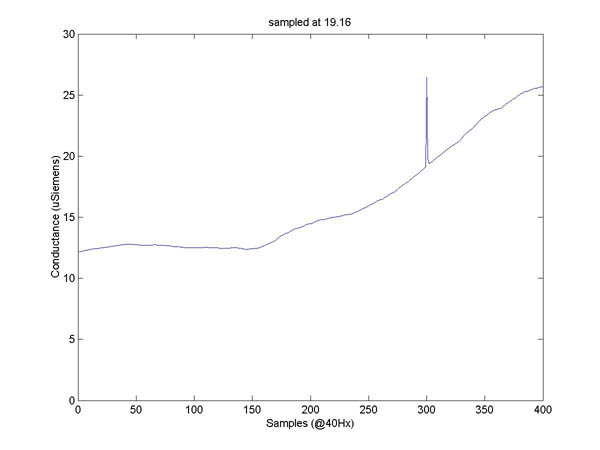
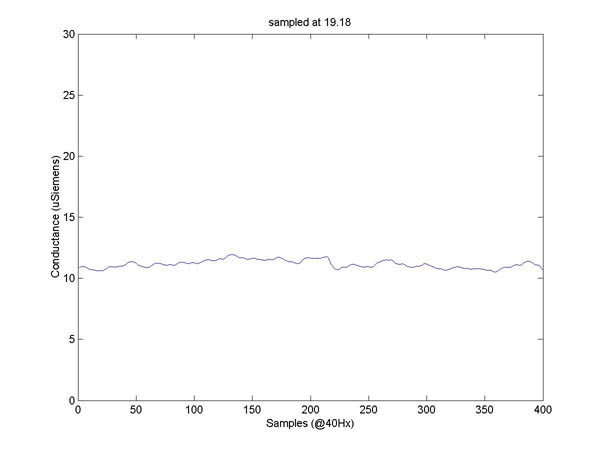
Figure 3. Plots of some the signals recorded on the mobile phone. The complete set is available here.
Eight segments of GSR data of duration of approximately 10 seconds were recorded over a period of 15 minutes while walking across MIT campus. The recorded signals are shown in Figure 3 and will be referred to as "input" signals or vectors.
To be able to analyse the data in a controlled environment the segments acquired on the phone were transferred to a PC and imported in Matlab. For the same purpose, 40 minutes of GSR data recorded on the PC using the same sensor in an office during various daily activities (talking on the phone, reading emails and scientific papers) were also imported in Matlab to be used as "test data", simulating the input of the display. To simulate the system behaviour, segments similar to the input vectors were searched within the 40 minutes recording using two variants of cross-correlation.
In the first case the cross correlation rid[m] between each of the 8 input vectors {xi[n]} and the test data {d[n]} was calculated according to the following definition: rid[m] = Sm(xi[n] xi[n-m], m=-M..M), where M is the length of the longer vector. In other words this corresponds to "sliding" one of the signals one sample at a time along the other and calculating the "dot product" of the two. [1]
In the second case the cross correlation was calculated using a sliding window of duration 10 seconds and overlapping for 75% of its duration. The data in each window was normalized and so were the input vectors, to ignore the amplitude of the sample but only take account of the "shape" of the waveform.
The plots of the results of the first operations can be found here. It can be clearly noticed that the result is approximately the same for each of the input waveforms and it is approximately equal to a smoothed version of the test data, and it is unusable. This is probably due to the fact that the input signals are nearly constant, so the cross-correlation operation results are very similar to the application of a moving average filter.
In the second case, the normalization of the waveforms seems to produce more interesting results, but only for one of the input signals (in this case it is possible to identify 3 maxima). This seems to suggest that the success of the operation is dependent on how rich of features the input signals are.
Conclusion and Future Work
In this project a first prototype of the Affective Photography system was implemented. This included the development of software to acquire and record the GSR signal from the HandWave Bluetooth sensor on a Series 60 mobile phone, as well as a software framework to acquire and process data in real time from the same sensor on a PC running Linux. The software was designed to be flexible and usable with other types of sensors. All the software was developed in C++ and it is available under GPL here.
The mobile phone was used to record samples of GSR data in a mobile context. A first analysis of the data revealed that a simple cross correlation does not give, in general, satisfactory results for the implementation of Affective Photography. The analysis suggests that the success is dependent on how rich of features the recorded GSR data is.
This hypothesis seems to be compatible with the findings from a previous class project on the same topic: "Skin Conductivity and Dream Analysis". In that project segments of GSR signal were selected by visual inspection, probably based on visual (shape) "features", then other segments exhibiting similar features were searched in the entire data set. The case proposed here is different in that segments of signal are selected in a way which is "blind" to their features, and most of them (7 out of 8) turned out to be nearly constant. It might still be possible to rely on the average GSR amplitude to match signal segments, however, the GSR baseline is known to vary depending on external factors, such as ambient temperature.
Most of the project time was spent on building the software to enable data acquisition on the mobile phone. This is independent of any particular processing technique and was a required step for data collection and analysis. Further work should focus on collecting and analysing more data and researching signal processing techniques suitable for implementing the Affective Photography concept. It should also be investigated whether the quality of the electrodes used for the experiment caused loss of features in the signal.
References
(in addition to html links)
[1] Proakis J.G., Manolakis M.G., "Digital signal processing: principles, algorithms, and applications", Prentice-Hall, 1996 ISBN:0-13-373762-4