Affective Computing - Final Project
Rob Hemsley - Fall 2011
| Experiment |
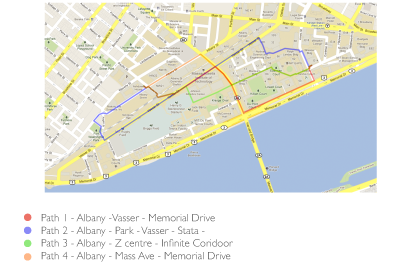
To understand how arousal levels alter based on location a self study was undertaken which focused on assessing how these levels altered while following a variety of routes between two predetermined locations. As shown in the figure below 4 separate paths were chosen between the Media Lab and one of MIT's graduate halls of residence. Each of these routes were selected with the intention of encountering various types of stimuli such as roads or congested corridors.
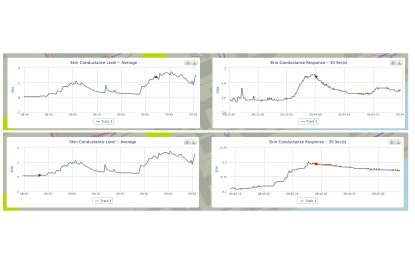
This data collection process was undertake over a 3 week period where recordings for both the GPS path and the EDA for the user were recorded. This produced 64 tracks of data which were then assessed on the quality of the EDA readings which in turn led to a final 11 tracks being selected for analysis. These were uploaded to the visualization tool where text based tags were added to the track further describing in line with the EDA the events and observations that were made during the journey. These paths with tag annotations can be viewed at the following location: http://maps.robhemsley.webfactional.com (Tags are hidden by default and can be enabled by selecting a track and the 'Show Comments' option) Results From this initial data set it was possible to identify various location which produced consistent results where EDA levels were observed to be higher. The most prominent example of this was observed where the user had to engage with the environment and make decisions regarding their actions. A clear example of this is illustrated below where the user must cross the road at a busy junction.
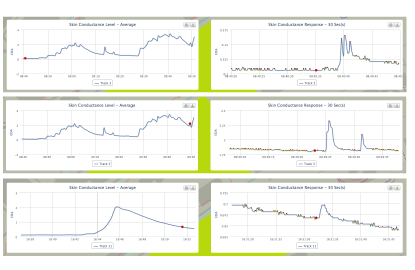
As show in the graph there is a clear peak in terms of EDA which reflects the cognitive load that the user is experiencing. By having to stop and wait at the crossing they are increasing this load as they must engage with the environment and asses when it is safe to cross. Having previously been walking without interruption there has been little opportunity to engage with the environment and so this sudden change leads to an increase in EDA activity. This assumption is similarly supported at various other locations where the users must engage with the environment. The following graphs were recorded as the user takes a short cut across a railway line which runs through the MIT campus.
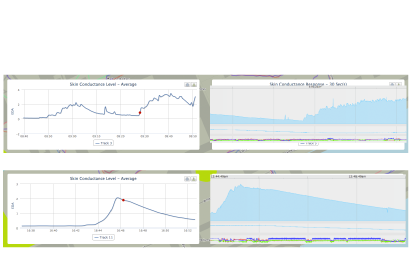
These graphs show a similar change to those observed when crossing the road where there is a sudden brief increase in the EDA. As this is an unofficial crossing the user must actively engage with the environment to determine whether it is safe cross and so as when having to cross the road there is an increase in the users cognitive load. Temperature In exploring the data set it is also notable that changes in temperature seem to have a direct effect on the quality of the EDA data and their relative readings. Traditionally EDA sensors tend to be used within a controlled environment where temperature remains static which is not the case in this experiment. This has meant that as the user moves through buildings that their body naturally responds to these changes and this is reflected within the EDA. The following graphs show the EDA and temperature when moving between buildings.
|