|
Motivation Gestalt perception is the name given to various phenomena that allow humans to do perceptual organization, including recognizing the relation between parts and wholes [Wilson, Keil]. Gestalt theorists argued that perception is holistic, that we perceive an overall visual effect that is greater than (or at least distinct from) the parts that compose the effect. This sum or combination of parts into wholes is known as gestalt grouping. Constructs in language, including referents like "those things" and collective nouns like "a bushel of apples," point to an underlying cognitive model that represents groups rather than individual items in many cases. Psychological experiments in memory capacity show, too, that humans can remember more items when they encapsulate sets of them in groups than when they attempt to recall all items individually. This research attempts to use clustering techniques with empirical verification to group the basic components of an image (such as characters and lines) into regions as similar as possible to those that the human visual system would perceive. We use features that describe the color, size, and position of the image components to decide how to cluster them together. We then compare our results to human groupings of the same images to see how our algorithms measure up. The motivation for this research comes partly from an idea that such a model of perception can be used to build tools that can describe documents to the blind. (It could also be used for document description over devices with very small or no displays, e.g., a mobile phone.) Present screen-reading systems have difficulty chunking and ordering the document as a sighted human reader would, especially for Web pages and other documents in which the structure of the file reflects the visual layout rather than the semantic contents. Web pages are designed visually and decoded visually by most users, so it makes sense that a screen reader should decode them visually as well. With a gestalt grouping process such as we present here, the screen reader could chunk the page visually and read the chunks in an order that reflects typical human gaze sequences, which are well-documented in psychological and graphic design literature. Previous work Wertheimer, in his seminal paper [Wertheimer 2000] on perceptual organization, postulated a set of characteristics to examine in identifying gestalt forms, including size, proximity, similarity, continuation and convexity. Previous work done in computationally modeling gestalt phenomena can be categorized into several broad areas of inquiry: (a) recognition of gestalt grouping principles; (b) segmentation, object detection and figure-ground separation in a visual scene; and (c) use as a framework for modeling general systems that use groupings made using gestalt principles. In research on recognition of gestalt properties, work has been done in designing good distance or similarity metrics to perform grouping [Zobrist, Thompson], detecting curvilinear continuity, good closure, and overall goodness of grouping. In segmentation and object detection, work has been done to use visual grouping for object recognition [Lowe] and using segmentation to generate descriptions [Mohan, Nevatia]. In the field of modeling general systems, there has been work done to generalize the grouping process [Amir, Lindenbaum] and to use perceptual organization for specific tasks such as document image and sketch understanding [Saund et al.]. These efforts provide a direction and methodology for creating a computational model to do object grouping using gestalt principles. Features
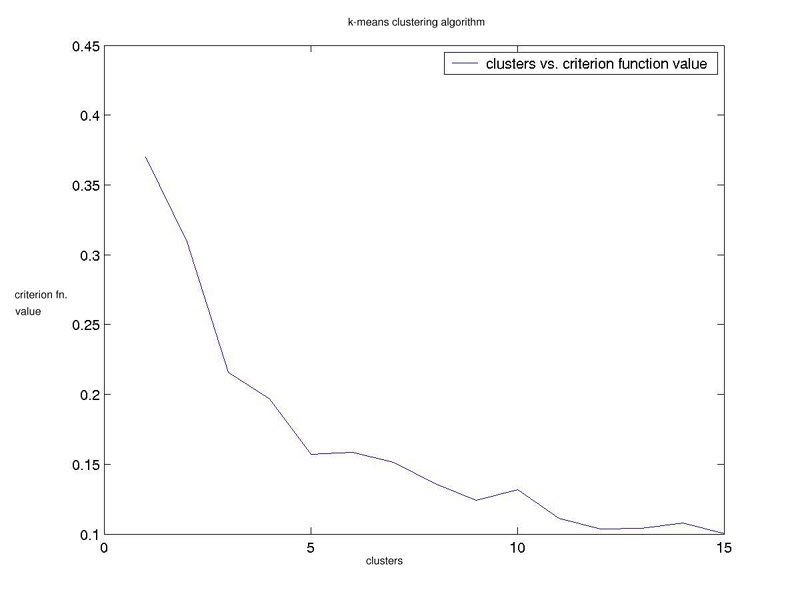
Approaches 1. K Means clustering We coded this algorithm in C++. The main thing we played around with here was the number of clusters and the similarity metrics that would give the result we wanted. The two metrics we used were MINKOWSKI distance and WEIGHTED SUM. A little more about the weighted sum. So, the motivation behind weighted sum was modeling the competition between certain feature types to grab visual attention and aid visual organization. Thus for a given visual scene color may be weighted heavily in response to the predominance of a given color in a scene. Or conversely due to an overwhelming uniformity in color position gets weighted higher as it will provide greater differentiation between clusters. Once we had the algorithm running, we decided to adapt the following free parameters to see how we could improve/modify our results:
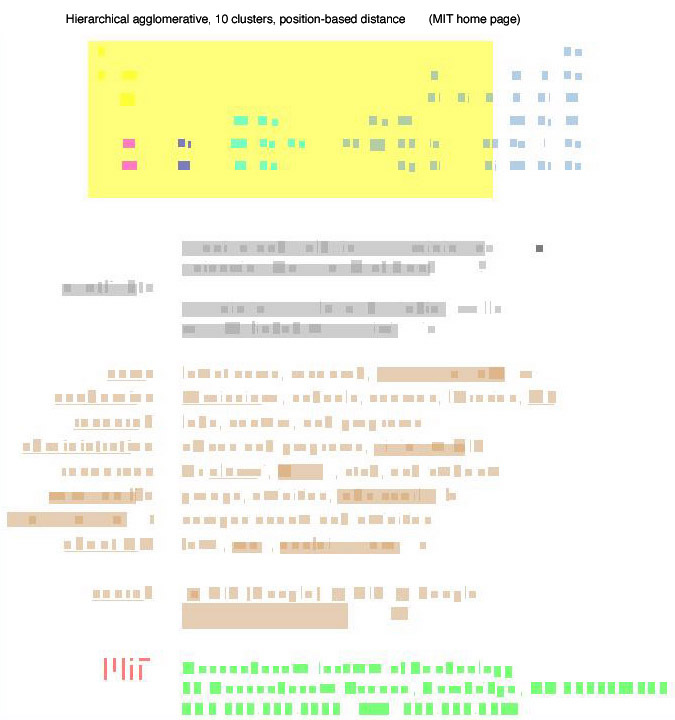
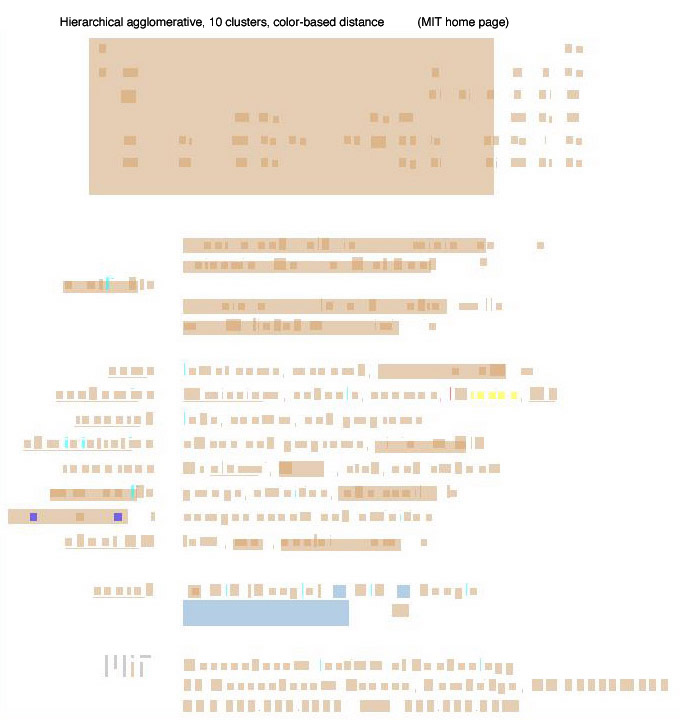
2. Hierarchical Clustering We implemented hierarchical agglomerative clustering to group the image regions based on the same three features as with K-means:
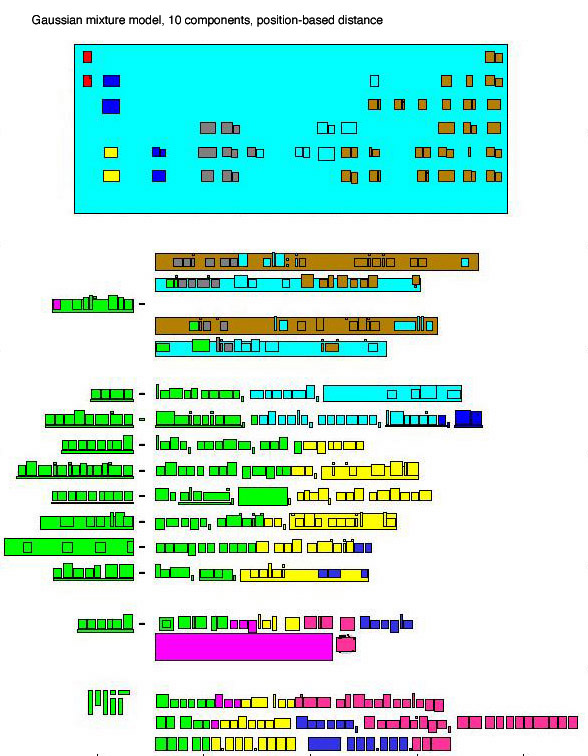
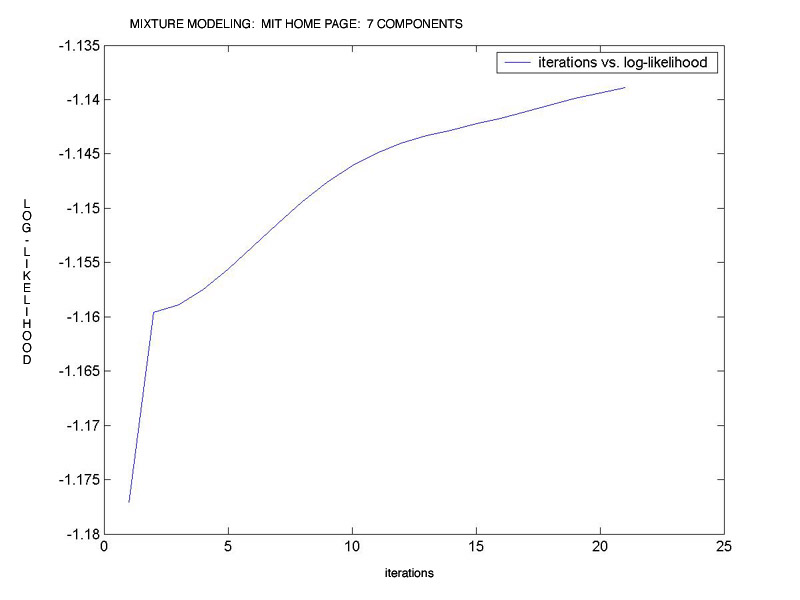
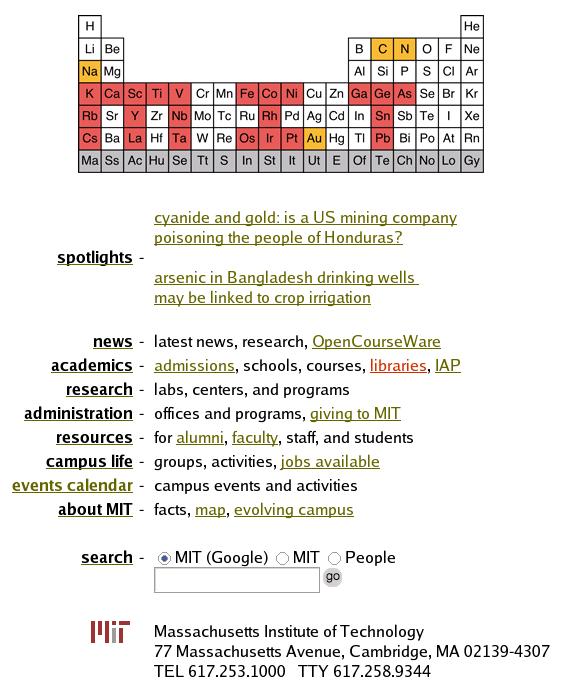
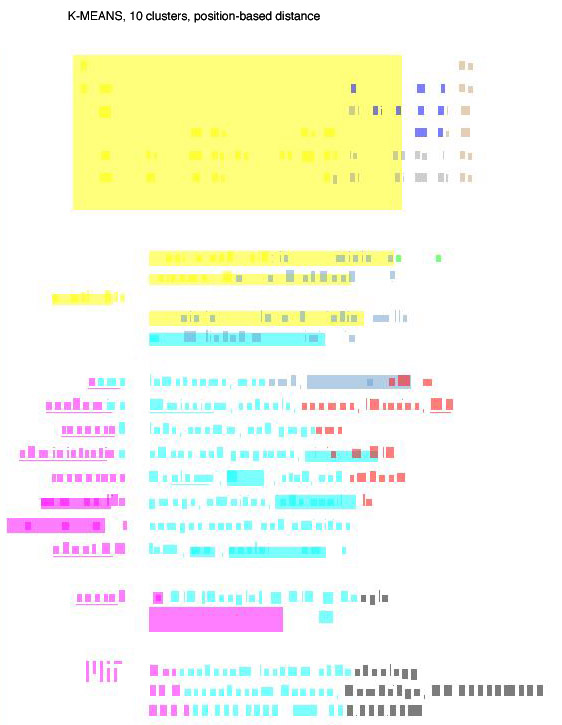
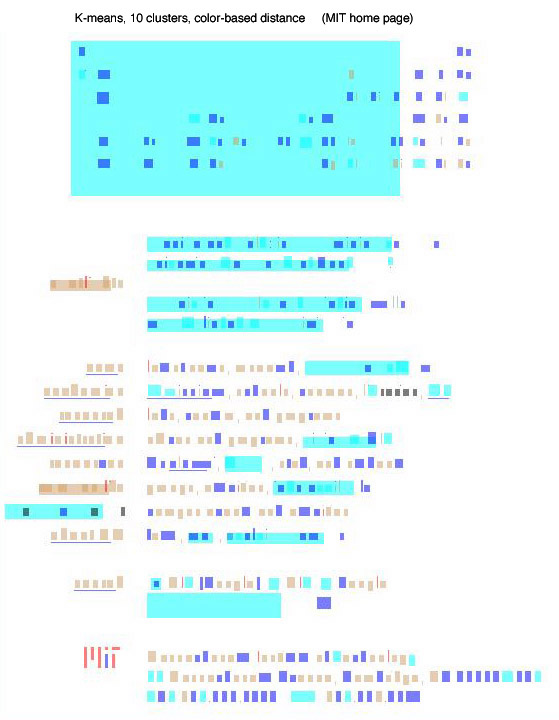
Our particular implementation of hierarchical clustering joined regions to groups based on the regions' proximity to the closest members of the groups, not the groups' centroids. This has the advantages of being computationally much simpler and being more likely to tie together proximate rather than distant regions. Hierarchical agglomerative, 10 clusters, position-based distance. Achieved 83.2 percent pairwise accuracy vs. human markup (as described below). [image] 3. Mixture Modeling We coded this approach in Matlab because it handles matrices more easily than C++. For the purpose of this algorithm, we considered an n-dimensional space with each block in our segmented region representing a point in that space. We tried to fit c gaussian distributions to the data points (that is, the blocks from the segmented image) tuning the parameters of our gaussian distributions using Expectation Maximization. The algorithm was initialized with equal component weights, and identity covariance matrices. We used proximity as the primary characteristic of the regions in fitting our gaussians. We tried color as well, but it greatly increased the computational cost and provided little or no gain in accurate fitting. The main factor we varied in this algorithm was how many gaussians would form our mixture. The stopping criterion for our algorithm was the log-likelihood of the data. This implies looking at the log of the probability that given the model parameters that we have found, what is the likelihood of these parameters explaining the given data. The higher the log-likelihood, the better is the fit to the data. Image of regions on MIT home page colored according to their most likely gaussian: [link] Graph of log-likelihood vs. iterations for fitting 7 gaussians to MIT home page image: [link] Evaluation Since we intend this project to be a first step toward assistive technologies that "see" a document's regions as humans do, we consider it vital to check our results against real human groupings. To do this, we developed a small Mac OS X application [screen shot] that allows a user to indicate regions on an image. The screen shot here shows a user marking a region on the MIT home page. We also developed a measure of success that compares our machine groupings to human groupings, which we consider on some level to be the "correct" groupings. Measure of success To compare the human groupings to the machine groupings, we consider the human groupings to be correct and use a pair-wise error rate to compare the machine groupings to them. Specifically, we count the number of correct and incorrect assignments by the machine according to the following: For each pair of basic visual components A and B, disregarding order:
= (total correct) / (number of pairs) This technique permits us to compare the groupings without having to identify the equivalences between the human and machine clusters, which would be a subjective and error-prone task. (That is, we can't ask simply if both the human and machine put node A in cluster 5, because "cluster 5" for the machine may be "cluster 2" for the human. What matters is which other nodes each node is with.) Using this measure, we evaluated a number of different kinds of machine groupings against an author's visual grouping of the MIT home page. These preliminary results suggest that hierarchical agglomerative clustering based on the position of the regions provides a very good approximation of human grouping, but other approaches also performed well. The best performance came from hierarchical clustering with a weight of 0.9 on position similarity and 0.05 each on color and size similarity. These parameters led to 87.9 percent pairwise accuracy as compared to the human's grouping of the regions. For reference, here is the original image of the MIT home page. Some other results:
Conclusions It seems clear that position is the best criterion for visually grouping regions on a Web page. The human-generated blockings of the MIT home page were well-matched by all of our algorithms when they used position as the primary criterion. Color and size did not fare as well, but we should note that the addition of small weightings of color and size improved the accuracy of a hierarchical agglomerative algorithm based primarily on position. Size seems to be a poor discriminant because the regions around many small letters all tend to be the same size. Similarly, many regions have a lot of white in the background, leading color similarity between regions with very different foregrounds to be misleadingly strong. Among the algorithms, hierarchical agglomerative provided the best performance, but k-means outperformed it when using size and color as primary distance criteria. Mixture-modeling came very close to hierarchical's performance using the position criterion. All of these techniques merit further exploration in this domain.Future directions As this is an ongoing research project, we intend to gather more human input to the grouping system. Once we have these data, we will apply supervised learning techniques to revise the weights that govern each feature's contribution to the clustering process. By iteratively revising these weights, we hope to approximate the weightings that the human visual system gives to these distinct elements as it perceives a document. This process may work as follows: update the weight vector of our weighted sum distance metric in the K-means clustering algorithm by looking at the differences between groups found through clustering and groups that a human finds in the same scene. For each misclassified block, find what was most similiar between this particular block and the cluster to which it should have been classified. For example, if a blue block from a group mainly composed of blue blocks is misclassified, then a function of this difference should be used to update the weight of color in the clustering algorithm. We are optimistic about this procedure to find weights that reasonably approximate human perception. One drawback of this strategy, though, is that it might train the weights to be optimal for only one particular data set (Web page). To generalize to all web pages, we need to find a link between elements of the scene and the weights of particular feature types. For example, a naive link would be the notion that a scene in which each block covers at least 40 percent of the scene area (with overlapping of blocks allowed) should cause the grouping algorithm to increase the weightage given to size similiarity. Another future direction would be to serialize the order in which we evaluate the different feature types. That is, first perform K-means using only the color of the regions. Then take the final mean values from that process and use them as initialization values for grouping based on position only.
|