Non-parametric Classification of Facial Features
Hyun Sung Chang
Department of Electrical Engineering and Computer Science
Massachusetts Institute of Technology
E-mail: hyunsung@mit.edu
Problem statement
In this project, I attempted to classify facial images based on various external characteristics, such as gender, expression, and accessories they are taking on.
Rather than extracting any particular parameters describing faces, e.g., the distances among eyes, nose, and mouse, I used grey-scale face images themselves, fitted to 128x128 window, as the inputs.
Dataset
The dataset used for this project together with detailed description is available here at the course website. The dataset consists of 2,000 training face images (faceR, 1,997 of them labeled) and 2,000 test face images (faceS, 1,996 of them labeled). Because the image size is 128x128, each image can be considered as a data point in a huge dimensional space. The dimensionality reduction has been conducted using principal component analysis (PCA) on 100 sample faces, all from the training dataset, so each image can be represented by 99 eigenface coefficients, as well as the mean face.
The composition of dataset is shown in Table 1. For example, notice that, in terms of expression, “funny” faces were significantly fewer than the other two classes and that few people wore glasses or bandana. One interesting thing is that no bandana image was included in the samples used to generate the eigenfaces.
Table 1. Dataset composition
|
|
gender |
|
|
expression |
|||
|
male |
female |
|
serious |
smiling |
funny |
||
|
Eigenface generating data |
61/100 |
39/100 |
|
Eigenface generating data |
45/100 |
51/100 |
4/100 |
|
Training data (faceR) |
1,150/1,997 |
847/1,997 |
|
Training data (faceR) |
917/1,997 |
1,043/1,997 |
37/1,997 |
|
Testing data (faceS) |
1,277/1,996 |
719/1,996 |
|
Testing data (faceS) |
1,097/1,996 |
836/1,996 |
63/1,996 |
|
|
glasses |
|
|
bandana |
||
|
on |
off |
|
on |
off |
||
|
Eigenface generating data |
4/100 |
96/100 |
|
Eigenface generating data |
0/100 |
100/100 |
|
Training data (faceR) |
59/1,997 |
1,938/1,997 |
|
Training data (faceR) |
13/1,997 |
1,984/1,997 |
|
Testing data (faceS) |
8/1,996 |
1,988/1,996 |
|
Testing data (faceS) |
8/1,996 |
1,988/1,996 |
Objective of this project
The objective of this project lies in two aspects:
1) to practice with meaningful classification problem using the methods learned from the class;
2) to look into inherent limitations of PCA approach.
Eigenface representation
Let ![]() be eigenfaces and
be eigenfaces and ![]() be the
sample faces used to generate the set of eigenfaces. The PCA finds
be the
sample faces used to generate the set of eigenfaces. The PCA finds ![]() so that
so that ![]() can be
well represented by their linear combinations. Let
can be
well represented by their linear combinations. Let ![]() be an arbitrary face and
be an arbitrary face and ![]() be its
eigenface representation, that is,
be its
eigenface representation, that is, ![]() .
.
Note that ![]() is just a linear combination of
is just a linear combination of ![]() , which
implies that the sensitivity issue should be aroused. For example, because
there was no bandana image in
, which
implies that the sensitivity issue should be aroused. For example, because
there was no bandana image in ![]() , we may see that
, we may see that ![]() and
and ![]() may be significantly
different from each other if
may be significantly
different from each other if ![]() is a facial image of the person who
is wearing a bandana.
is a facial image of the person who
is wearing a bandana.
The approximation error between ![]() and
and ![]() can be measured
in terms of peak-signal-to-noise-ratio (PSNR) defined by
can be measured
in terms of peak-signal-to-noise-ratio (PSNR) defined by
 ,
,
where ![]() is the number of pixels.
is the number of pixels.
Figure 1 shows a bandana image example. The PSNR is as low as 14.47dB. Note that, in eigenface representation, other regions than the bandana pixels were also severely distorted as a result of making best efforts to compensate for the bandana region. This may lead to the classification errors even also for the other criteria, not only for the bandana.
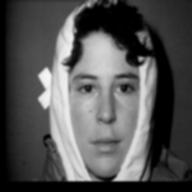
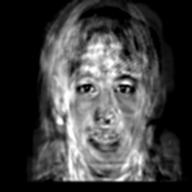
Figure 1. Bandana image example and its eigenface approximation.
Figure 2 shows the actual PSNR distribution for the training dataset and the test dataset. The images in the test dataset show somewhat low PSNR; for some particular samples, the PSNR was significantly low. This low PSNR may contribute to the classification error.
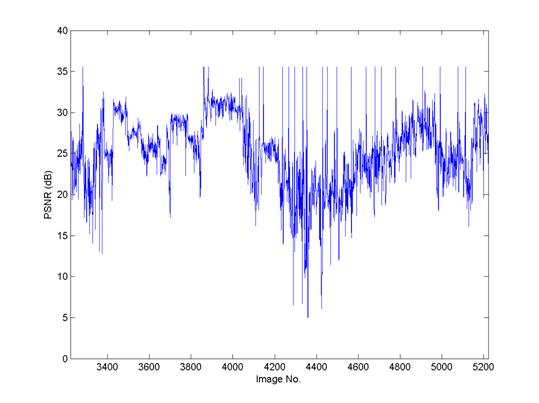
Figure 2. PSNR distribution of each face image in training dataset (faceR) and in test dataset (faceS). (left: faceR, right: faceS)
Figure 3 illustrates how the discriminant value and the PSNR for gender classification (+ = male, - = female) when a linear discriminant was used. Note that a majority of male samples of high PSNR were correctly classified. For the female samples, such a correlation was not that noticeable; instead, the discriminant value and the PSNR looked rather uncorrelated. I think this may be because of the inherent ill-performance of our classifier against female images (See Table 2)
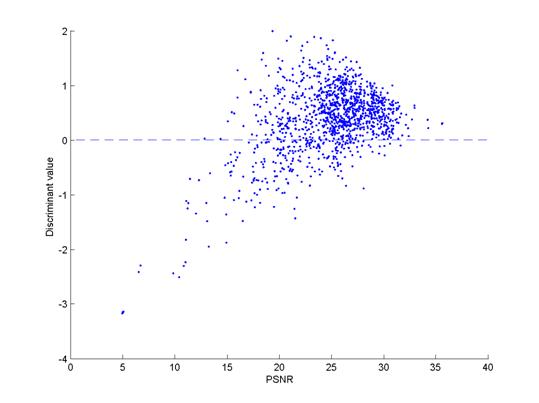
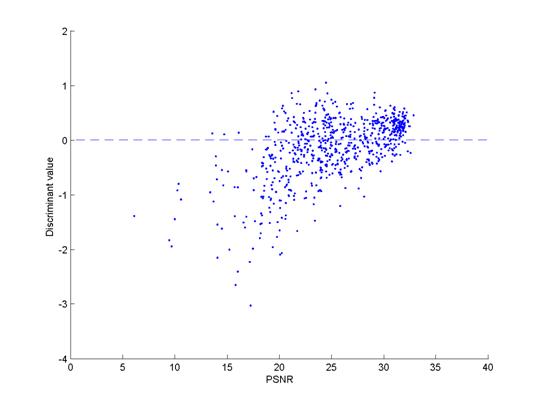
Figure 3. Plot of discriminant value versus PSNR for male and female face samples. (left: male, right: female)
Classification practice
For this part of experiment, the following classification schemes were tested:
- k-NN method (k-NN)
- Linear discriminant (LD)
- Neural network with one-hidden layer (NN-2)
- Neural network with two-hidden layers (NN-3)
Also the performance may have to be compared to random guess schemes.
- RG-1: choose the class whose prior probability is maximum
- RG-2: choose the class randomly according to their prior probabilities
Table 2 through Table 5 show the classification results. In most cases, LD and NN-2 showed best performance than the other two schemes and also than the two RG schemes.
Nearly all classifiers failed to detect the glasses, bandana, and also “funny” expression which are all characterized as extreme minority, i.e., whose prior probability is very low.
Table 2. Comparison of k-NN (![]() ), LD, NN-2 (
), LD, NN-2 (![]() ), NN-3 (
), NN-3 (![]() ), RG-1, RG-2
for gender classification.
), RG-1, RG-2
for gender classification.
|
k-NN |
detect |
miss |
|
LD |
detect |
miss |
|
male |
823 |
454 |
|
male |
1,026 |
251 |
|
female |
402 |
317 |
|
female |
375 |
344 |
|
|
|
|
|
|
|
|
|
NN-2 |
detect |
miss |
|
NN-3 |
detect |
miss |
|
male |
1,008 |
269 |
|
male |
763 |
514 |
|
female |
378 |
341 |
|
female |
544 |
175 |
|
|
|
|
|
|
|
|
|
RG-1 |
detect |
miss |
|
RG-2 |
detect |
miss |
|
male |
1,277 |
0 |
|
male |
753 |
542 |
|
female |
0 |
719 |
|
female |
305 |
414 |
Table 3. Comparison Comparison of k-NN (![]() ), LD, NN-2 (
), LD, NN-2 (![]() ), NN-3 (
), NN-3 (![]() ), RG-1, RG-2
for expression classification.
), RG-1, RG-2
for expression classification.
|
k-NN |
detect |
miss |
|
LD |
detect |
miss |
|
serious |
586 |
511 |
|
serious |
936 |
161 |
|
smiling |
468 |
368 |
|
smiling |
623 |
213 |
|
funny |
0 |
63 |
|
funny |
0 |
63 |
|
|
|
|
|
|
|
|
|
NN-2 |
detect |
miss |
|
NN-3 |
detect |
miss |
|
serious |
932 |
165 |
|
serious |
963 |
134 |
|
smiling |
617 |
219 |
|
smiling |
593 |
243 |
|
funny |
0 |
63 |
|
funny |
0 |
63 |
|
|
|
|
|
|
|
|
|
RG-1 |
detect |
miss |
|
RG-2 |
detect |
miss |
|
serious |
0 |
1,097 |
|
serious |
504 |
593 |
|
smiling |
836 |
0 |
|
smiling |
437 |
399 |
|
funny |
0 |
63 |
|
funny |
1 |
62 |
Table 4. Comparison of k-NN (![]() ), LD, NN-2 (
), LD, NN-2 (![]() ), NN-3 (
), NN-3 (![]() ), RG-1, RG-2
for glasses detection.
), RG-1, RG-2
for glasses detection.
|
k-NN |
detect |
miss |
|
LD |
detect |
miss |
|
on |
0 |
8 |
|
on |
0 |
8 |
|
off |
1,988 |
0 |
|
off |
1,986 |
2 |
|
|
|
|
|
|
|
|
|
NN-2 |
detect |
miss |
|
NN-3 |
detect |
miss |
|
on |
2 |
6 |
|
on |
0 |
8 |
|
off |
1,962 |
16 |
|
off |
1,958 |
30 |
|
|
|
|
|
|
|
|
|
RG-1 |
detect |
miss |
|
RG-2 |
detect |
miss |
|
on |
0 |
8 |
|
on |
0 |
8 |
|
off |
1,988 |
0 |
|
off |
1,988 |
0 |
Table 5. Comparison of k-NN (![]() ), LD, NN-2 (
), LD, NN-2 (![]() ), NN-3 (
), NN-3 (![]() ), RG-1, RG-2
for bandana detection.
), RG-1, RG-2
for bandana detection.
|
k-NN |
detect |
miss |
|
LD |
detect |
miss |
|
on |
0 |
8 |
|
on |
0 |
8 |
|
off |
1,988 |
0 |
|
off |
1,988 |
0 |
|
|
|
|
|
|
|
|
|
NN-2 |
detect |
miss |
|
NN-3 |
detect |
miss |
|
on |
0 |
8 |
|
on |
0 |
8 |
|
off |
1,988 |
0 |
|
off |
1,986 |
2 |
|
|
|
|
|
|
|
|
|
RG-1 |
detect |
miss |
|
RG-2 |
detect |
miss |
|
on |
0 |
8 |
|
on |
0 |
8 |
|
off |
1,988 |
0 |
|
off |
1,988 |
0 |
From this experiment, I concluded that
1) Samples from minority class (with very low prior probability) tend to be miss-classified with any classifier;
2) Eigenface approach is good for identity recognition purpose, robust to noise and partial loss of data, but not as good for classification purpose dealing with extraneous face samples, i.e., not used for the eigenface generation.
Remarks
After Monday presentation, I applied AdaBoost on LD and Parzen window for each classification and obtained preliminary results, but the classification performance was not improved so much. Particularly, I am looking into the working details for Parzen window since my preliminary results were far from those in [2]. Mostly due to limited time, multi-linear analysis method has not been attempted. Future direction of study should include the analytical and experimental study of multi-linear analysis method.
References
[1] Richard O. Duda, Peter E. Hart, and David G. Stork, Pattern Classification. New York, NY: John Wiley & Sons, 2001.
[2] Tiwari, “Face recognition: eigenfaces with 99 PCA coefficients,” MAS.622J/1.126J Project Presentation, MIT, Fall 2004. [ppt]
[3] W. S. Yambor, “Analysis of PCA-based and Fisher discriminant-based image recognition algorithms,” Master's thesis, Dept. of Comp. Sci., Colorado State Univ., July 2000. [pdf]
[4] M. Turk and A. Pentland, “Eigenfaces for recognition,” J. Cogn. Neurosci., vol. 3, no. 1, pp. 71-86, 1991. [pdf]
[5] H. A. Rowely, S. Baluja, and T. Kanade, “Neural network based face detection,” IEEE Trans. Pattern Anal. Machine Intell., vol. 20, no. 1, pp. 23-38, Jan. 1998. [pdf]
[6] Face recognition homepage. [Online]. Available: http://www.face-rec.org
*This page has been written as a final project report for MAS.622J/1.126J. Pattern Recognition and Analysis taken in Fall 2006.