Predictors
for Human Temperature Comfort
mark
feldmeier
Introduction
All
homes and offices have environmental control systems. These usually
consist of a source of hot or cold air, and a thermostat located
nearby which turns the source on or off to regulate the temperature
of the room. Unfortunately, the inhabitants of most spaces are not
located near the thermostat, so the system does not adequately
regulate the temperature for their comfort. The system also does not
know whether or not a person is in the room, requiring that the
ventilation run continuously, regardless of its demand. A more
energy efficient and effective environmental control system can be
achieved by placing the thermostat on the person, creating a more
personalized and responsive space which knows when people enter a
room, and what their current comfort level is.
The
objective of this work is to determine the ability of a simple sensor
system to predict human temperature comfort. Our perceived comfort
level is a function of many factors: metabolic rate, stress,
fatigue, activity level, etc. It is possible that there is no clear
correlation between ambient air temperature and our perception of hot
or cold. Exactly how does our body express its comfort level?
Further more, for this wearable thermostat to be economically and
socially acceptable, it must contain a minimum complement of sensors
to keep costs down, and have these sensors located on the body in
such a fashion as to not bother the user. In the ideal case, a
single sensor would be worn as a button on the user's shirt, and
transmit the user's preference wirelessly to the environmental
control system.
|
Methodology
There
are many possible locations and types of sensors which could be of
use to the wearable thermostat. The locations chosen for this
work are based upon places on the body which are currently
ornamented: finger (rings), wrist (watches), neck (necklaces),
chest (necklaces), shirt exterior (pendants). And, although there
are many sensors which may be relevant, temperature and humidity
sensors were chosen as the most likely candidates for predicting
environmental comfort. To this end, a wearable temperature and
humidity logging device (see Figure 1) was developed which would
record the time of day, all sensor readings, and the user's
comfort level. Every five minutes, a pager motor on the device
would vibrate, queuing the user to input his preference. One
button represented 'hot' (+1), the other 'cold' (-1), and both
pressed at the same time represented 'neutral' (0). 'hot' and
'cold' were determined by the user as states where, if given the
option, an outer layer of clothing would be added or removed to
help improve thermal comfort. A sample of the raw sensor data can
be seen in Figure 2. The system was worn and trained for a single
user, as thermal comfort patterns are different for each person,
and a wearable thermostat would have to learn the preferences of
its owner.
|
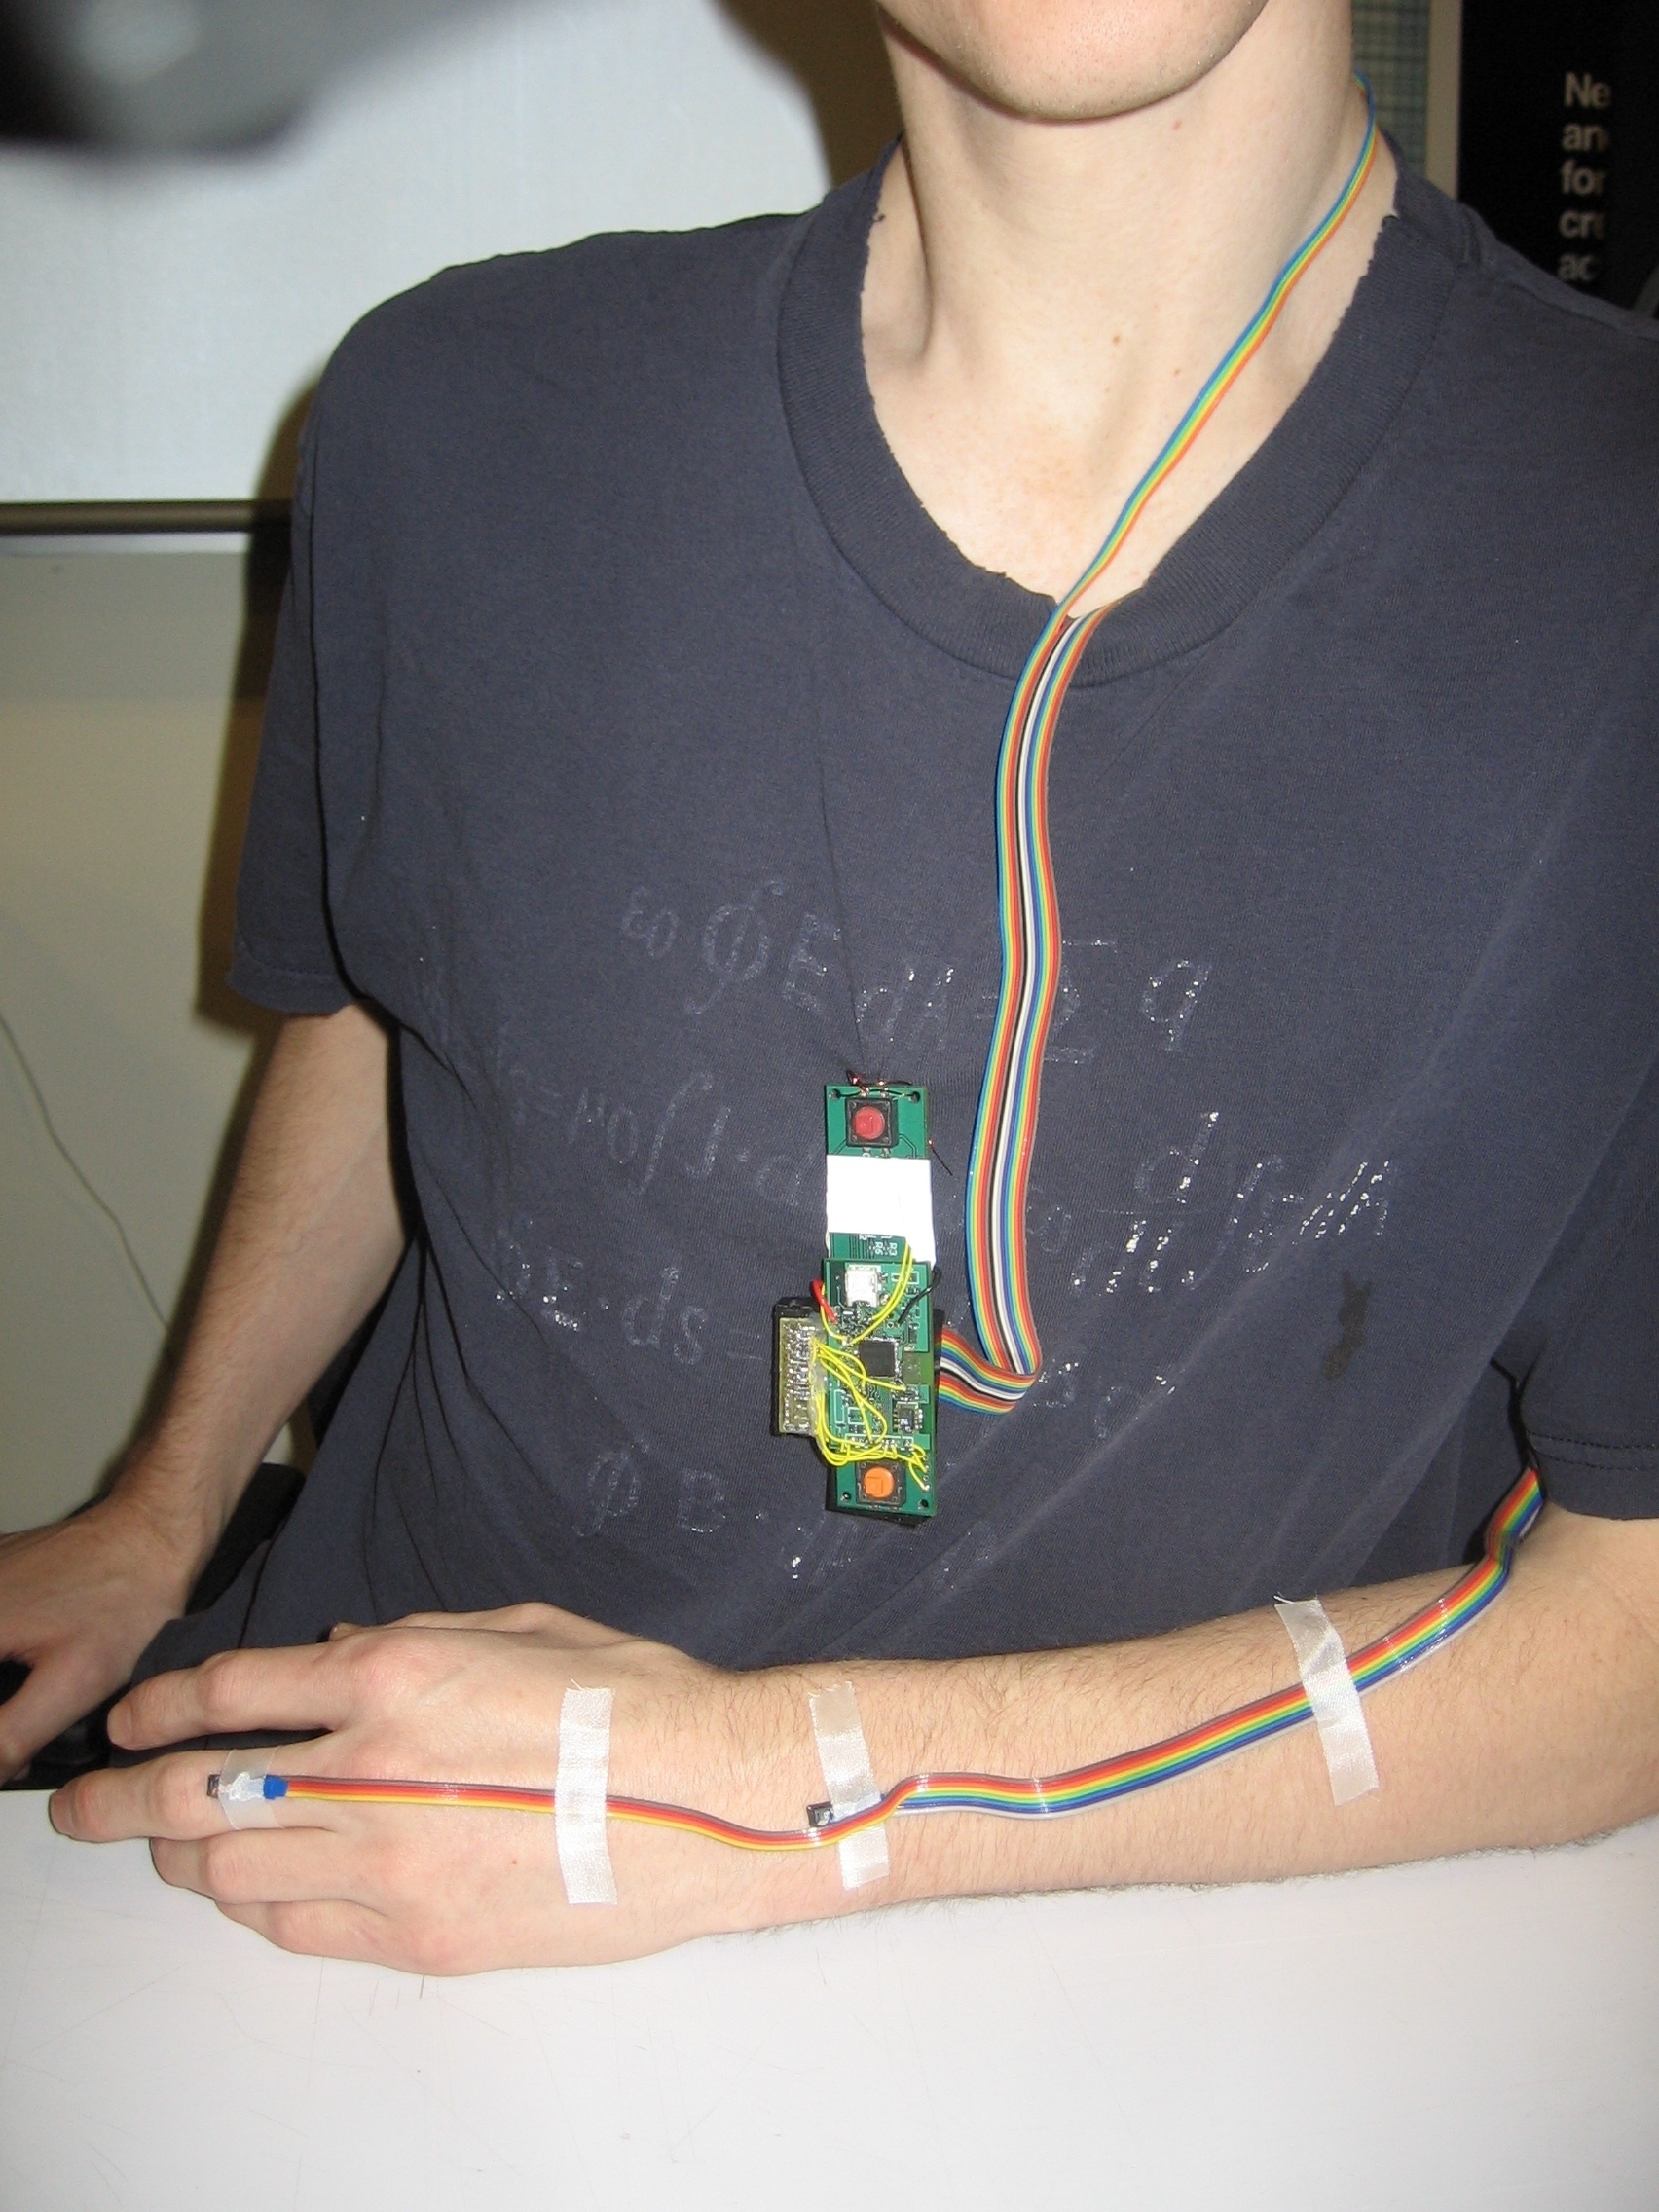
Figure 1: Sensor
system as worn by user
|
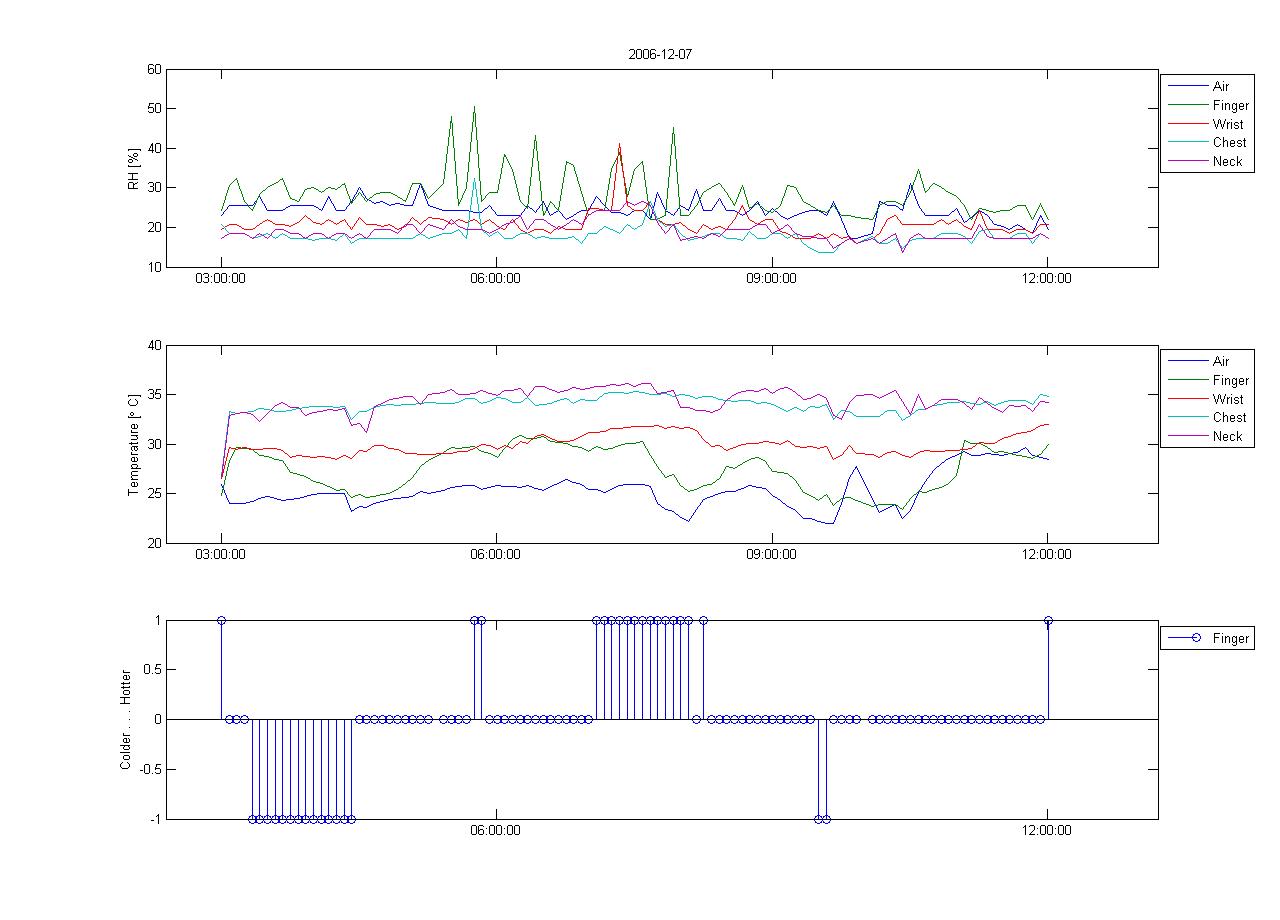
Figure
2: Raw data from sensors (Humidity, Temperature, Preference)
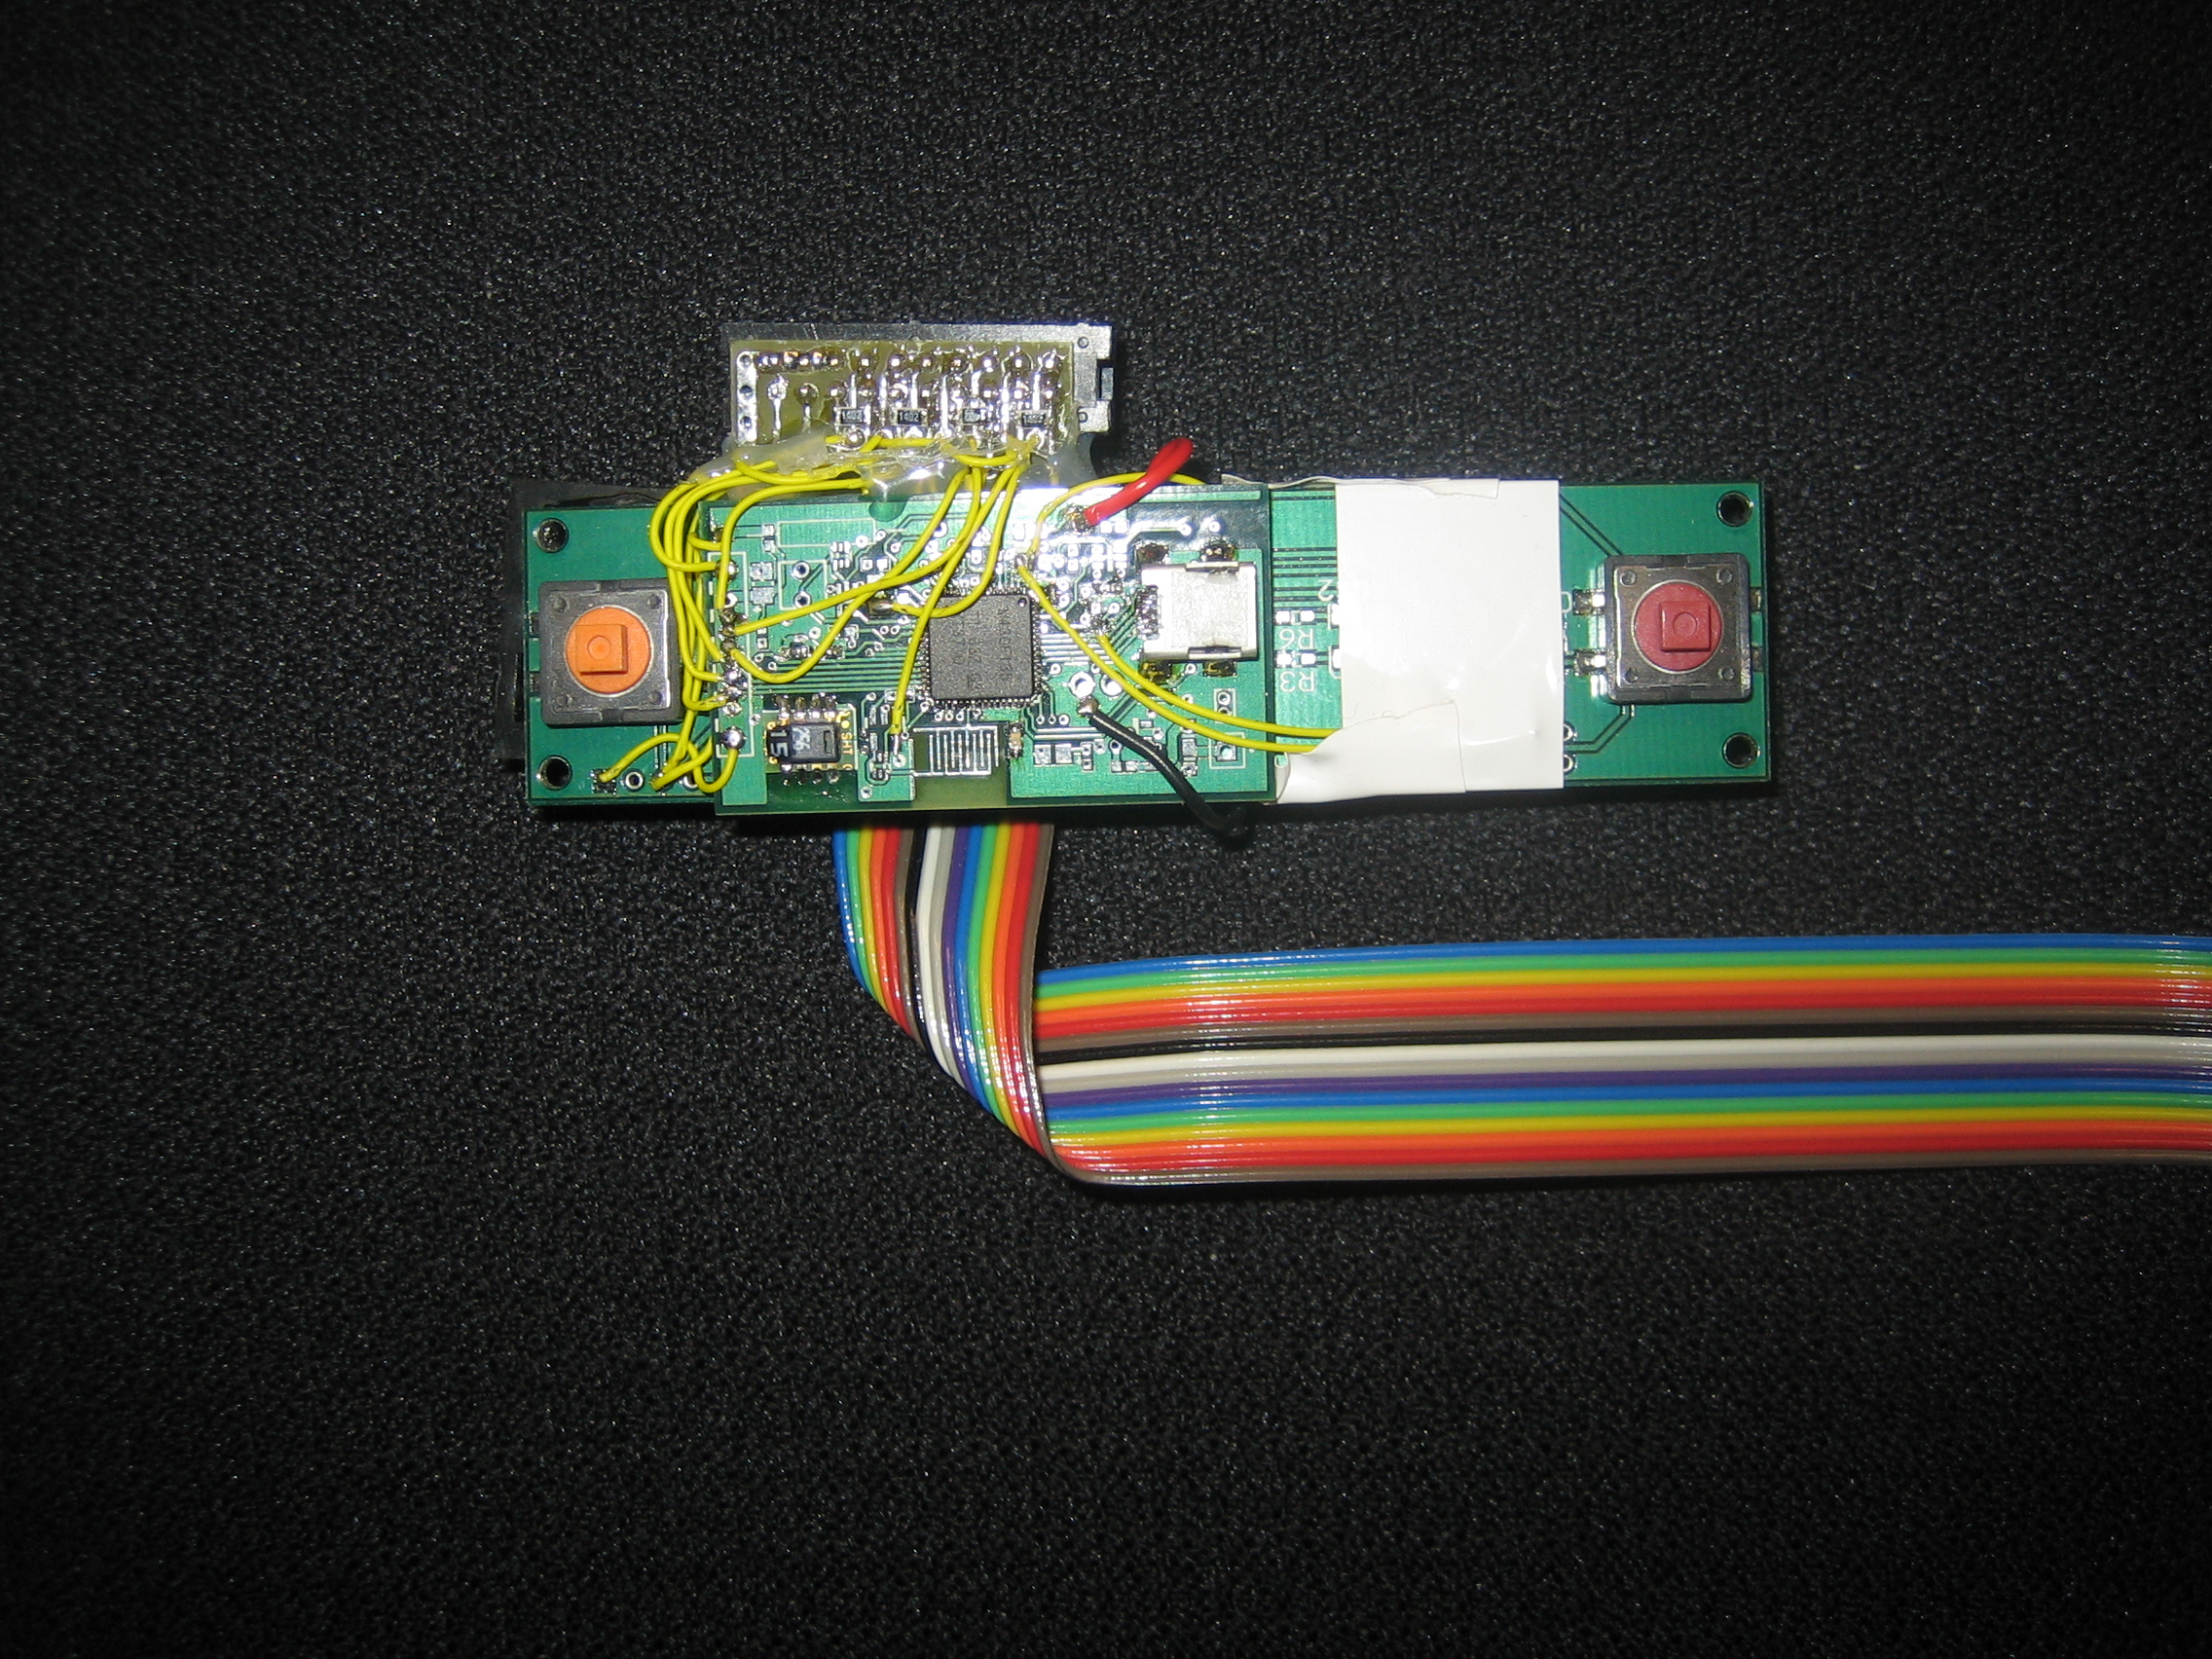
Hardware
The
core of the sensing system (see Figure 3) is based upon the CARGONET
environmental data logging board developed by Mateusz Malinowski. It
has a TI MSP430, low power micro controller which communicates with
the sensors, logs the data, and uploads these data to a computer via
USB. It also has a real time clock for logging time and waking up
the system from sleep mode every five minutes. Finally, it has an on
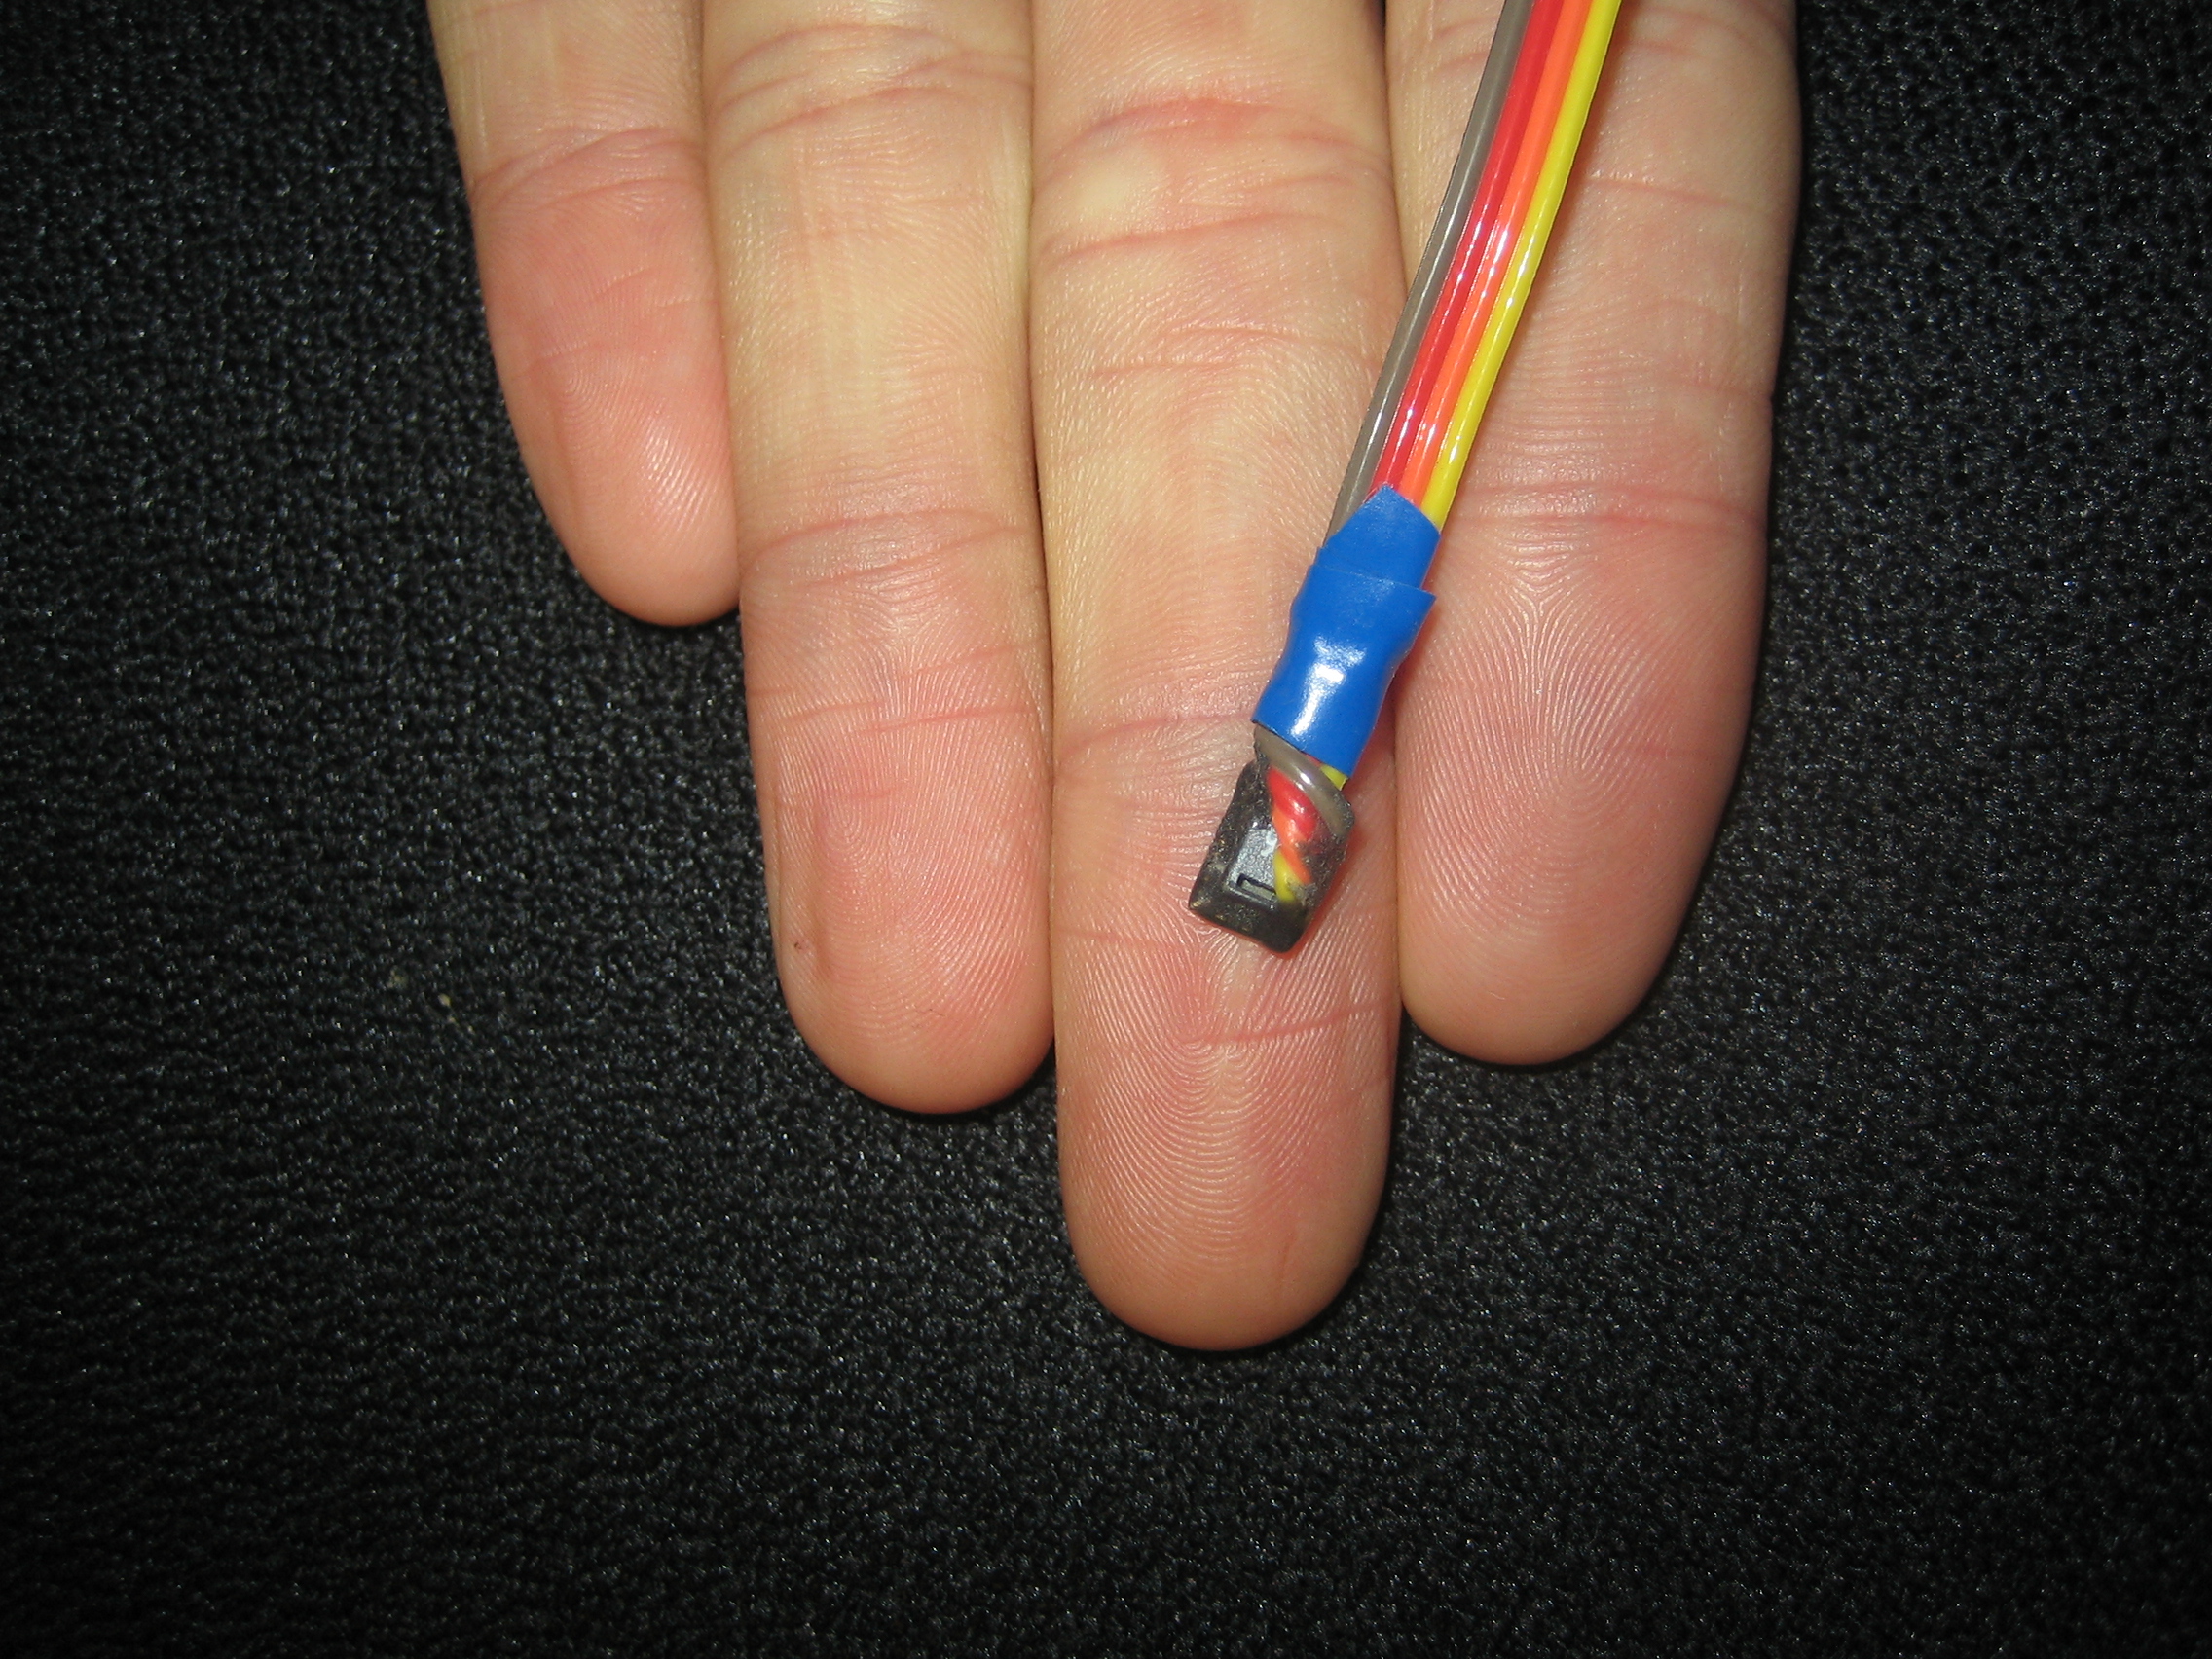
board temperature and humidity sensor. All sensors in the system
are the Sensirion SHT15 (see Figure 4), which is extremely small, has
a fast response time (<4s), combines both humidity and temperature
sensing in one package, and has humidity accuracy of +/-2% RH and
temperature accuracy of +/-.3 degrees Celsius. Four of these
sensors were tethered via ribbon cable to be mounted to the body at
the aforementioned locations with medical tape, and the fifth sensor
was located on the board to gather ambient air temperature at the
user's location. This gives a total of 10 sensors at five locations.
|
|
|
|
Figure
3: Data logging system
|
Figure
4: SHT15 temperature and humidity sensor
|
Data
Analysis
Data
was collected for four days, giving 360 data points. Given the large
dimensionality of the data set, this is a relatively small set of
data points. To help reduce non-representative results given this
small data set, the results were averaged over the entire data set.
This was done by dividing the data into ten random sets without
replacement. The algorithms were then trained on 9 of these sets and
tested on the remaining one. This was then repeated for all 10
permutations of the sets, and the testing results were averaged over
these permutations. The time data was not used, as the moving
between hot and cold environments required to gather enough data
points in each class produced a time series which did not relate to
the current level of comfort.
Two
different algorithms were chosen to test the ability of the system to
predict the thermal comfort of the user. The first was a Gaussian
model which simply took the mean and covariance of each of the sets
of the training data marked by the user as hot, cold, and neutral.
The testing data points were then inputted to each of the models, and
each testing data point would receive the class of the model which
returned the maximum value. The accuracy of the system was
determined by the total number of correct labellings, divided by the
total number of testing data points. The second algorithm was a
K-Nearest Neighbor algorithm which was trained with a leave one out
strategy. The tested data point would assume a class label which
represents the average of the K nearest neighbors' class labels.
Since the system rounded .5 up to 1 and -.5 down to -1,
this broke ties by favoring either 'hot' or 'cold' over neutral,
assuming that there would generally not be a tie between 'hot' and
'cold'. The value of K was chosen as the value, less than 10, which
returned the highest accuracy on the training data, when trained on
all possible permutations of which data point was left out. K was
chosen to be less than 10 to keep processing time down, as 10 was the
maximum value observed for a few runs which were allowed to test
values of K up to the number of data points in the training set.
Results
These
two algorithms were then tested on all possible sensor combinations.
The top ten sensor combinations for each quantity of sensors were
returned, along with the accuracies associated with these
combinations (see Figure 6). A plot of the maximum accuracy versus
sensor quantity can be seen in Figure 5. The K-Nearest Neighbor
algorithm was more accurate than the Gaussian model, although they
both showed a maximum accuracy with seven sensors. The dotted line
in Figure 5 shows the maximum accuracy achievable with each model
given the number of body positions rather than the number of sensors.
For example, 1 represents one sensor at one point on the body, 2
represents two sensors at the same location on the body, and 7
represents seven sensors at 4 locations on the body.
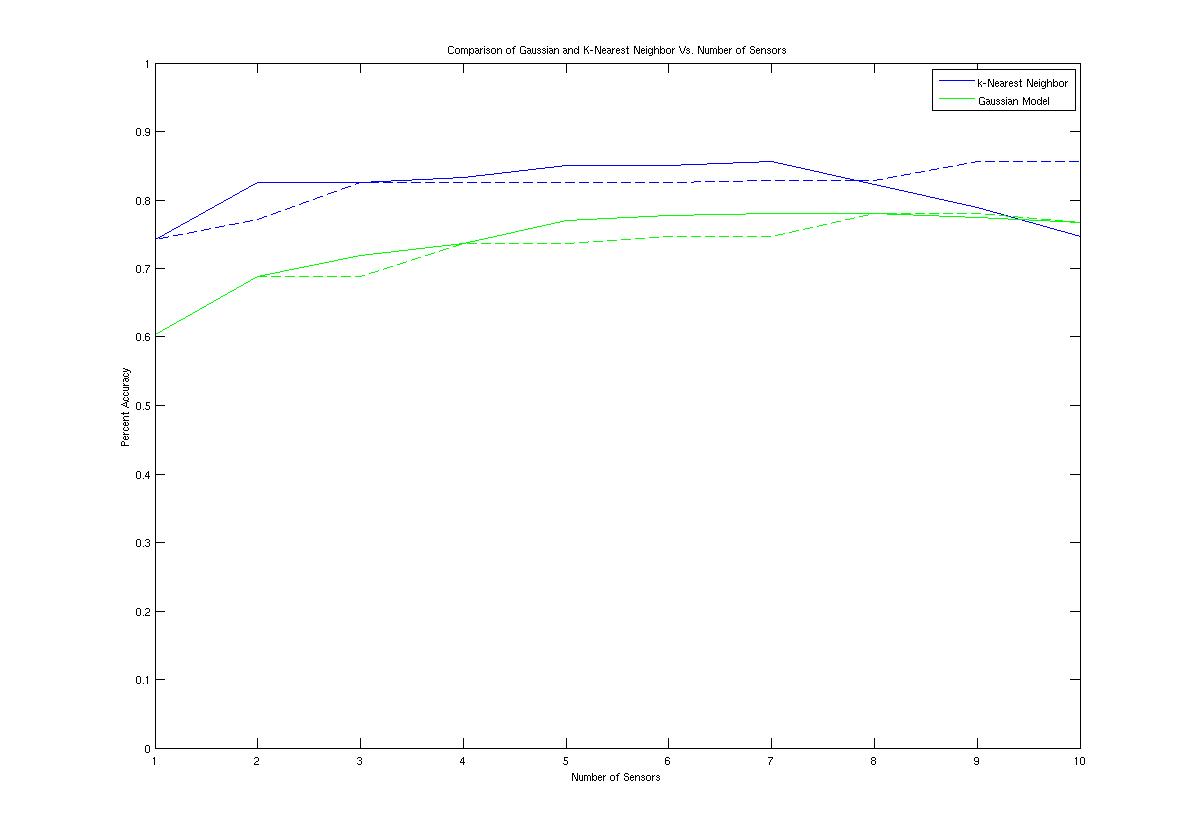
Figure
5: Maximum accuracy versus number of sensors for Gaussian model and
K-Nearest Neighbors
From
Figure 6 it can be seen that the wrist temperature sensor was the
best single sensor, with the chest humidity sensor being the next
best sensor to add. The chest temperature sensor was the third best
sensor to add, with minimal improvements in accuracy from adding more
sensors. Both algorithms concur on which sensors have the strongest
correlation with thermal comfort.
-
|
Sensor Number
|
Sensor Location
/ Type
|
|
1
|
hand / humidity
|
|
2
|
hand / temperature
|
|
3
|
wrist / humidity
|
|
4
|
wrist /
temperature
|
|
5
|
chest / humidity
|
|
6
|
chest /
temperature
|
|
7
|
neck / humidity
|
|
8
|
neck / temperature
|
|
9
|
air / humidity
|
|
10
|
air / temperature
|
-
|
Sensor
Number(s)
|
K-NN
Accuracy
|
Sensor
Number(s)
|
Gaussian
Accuracy
|
|
8
|
0.6028
|
9
|
0.3333
|
|
7
|
0.6250
|
2
|
0.3417
|
|
9
|
0.6417
|
3
|
0.3667
|
|
1
|
0.6583
|
10
|
0.3972
|
|
10
|
0.6611
|
8
|
0.3972
|
|
6
|
0.6806
|
6
|
0.4361
|
|
2
|
0.6833
|
7
|
0.4417
|
|
3
|
0.6861
|
5
|
0.5250
|
|
5
|
0.7222
|
1
|
0.5806
|
|
4
|
0.7417
|
4
|
0.6028
|
|
|
|
|
|
|
4 7
|
0.7556
|
1 9
|
0.6000
|
|
4 9
|
0.7556
|
4 9
|
0.6083
|
|
5 9
|
0.7583
|
3 4
|
0.6250
|
|
2 4
|
0.7583
|
4 7
|
0.6333
|
|
3 4
|
0.7611
|
1 4
|
0.6417
|
|
4 10
|
0.7639
|
5 8
|
0.6472
|
|
5 6
|
0.7722
|
4 5
|
0.6528
|
|
4 8
|
0.7806
|
4 8
|
0.6778
|
|
4 6
|
0.8194
|
4 6
|
0.6861
|
|
4 5
|
0.8250
|
5 6
|
0.6889
|
|
|
|
|
|
|
2 4 5
|
0.7806
|
3 5 6
|
0.6889
|
|
2 3 5
|
0.7861
|
1 5 6
|
0.6944
|
|
4 5 9
|
0.7861
|
2 4 6
|
0.6944
|
|
2 4 6
|
0.7944
|
5 6 8
|
0.6944
|
|
3 4 5
|
0.7972
|
3 4 6
|
0.6944
|
|
4 5 8
|
0.8056
|
1 4 6
|
0.6972
|
|
4 5 10
|
0.8083
|
4 6 9
|
0.6972
|
|
4 6 10
|
0.8083
|
4 6 8
|
0.7000
|
|
4 6 8
|
0.8111
|
4 6 7
|
0.7167
|
|
4 5 6
|
0.8250
|
4 5 6
|
0.7194
|
|
|
|
|
|
|
4 5 7 10
|
0.8028
|
1 4 6 8
|
0.7194
|
|
4 7 9 10
|
0.8083
|
2 4 5 6
|
0.7222
|
|
2 4 6 10
|
0.8083
|
1 4 6 9
|
0.7222
|
|
4 5 9 10
|
0.8083
|
1 4 5 6
|
0.7250
|
|
2 4 6 8
|
0.8139
|
1 4 6 7
|
0.7250
|
|
2 4 5 7
|
0.8139
|
3 4 6 8
|
0.7250
|
|
2 4 5 8
|
0.8139
|
3 4 5 6
|
0.7278
|
|
3 4 5 10
|
0.8194
|
4 6 7 8
|
0.7278
|
|
2 4 5 6
|
0.8222
|
4 6 8 9
|
0.7361
|
|
4 5 6 10
|
0.8333
|
4 5 6 8
|
0.7361
|
|
|
|
|
|
|
2 4 5 6 8
|
0.8194
|
4 6 7 8 9
|
0.7333
|
|
2 4 5 8 10
|
0.8194
|
1 3 4 5 6
|
0.7361
|
|
4 5 6 7 10
|
0.8194
|
1 4 6 7 8
|
0.7389
|
|
4 5 6 8 9
|
0.8194
|
4 5 6 7 8
|
0.7389
|
|
4 5 7 8 10
|
0.8194
|
1 3 4 6 8
|
0.7417
|
|
2 3 5 6 10
|
0.8222
|
2 4 5 6 8
|
0.7444
|
|
4 5 6 8 10
|
0.8278
|
2 3 4 5 6
|
0.7472
|
|
2 3 4 5 8
|
0.8306
|
3 4 5 6 8
|
0.7472
|
|
2 4 5 7 8
|
0.8333
|
1 4 6 8 9
|
0.7500
|
|
2 4 5 7 10
|
0.8500
|
1 4 5 6 8
|
0.7694
|
|
|
|
|
|
|
2 4 5 6 9 10
|
0.8167
|
4 5 6 7 8 10
|
0.7500
|
|
4 5 7 8 9 10
|
0.8167
|
1 3 4 6 8 9
|
0.7528
|
|
2 3 4 5 8 10
|
0.8194
|
1 4 6 7 8 9
|
0.7528
|
|
4 5 6 8 9 10
|
0.8194
|
3 4 5 6 8 9
|
0.7528
|
|
2 4 5 6 7 8
|
0.8222
|
1 2 4 5 6 8
|
0.7556
|
|
2 3 4 5 6 10
|
0.8361
|
1 3 4 5 6 8
|
0.7583
|
|
2 4 5 7 8 10
|
0.8361
|
1 4 5 6 8 9
|
0.7639
|
|
2 3 4 5 6 8
|
0.8389
|
1 4 5 6 7 8
|
0.7750
|
|
2 4 5 6 7 10
|
0.8500
|
2 4 5 6 7 8
|
0.7778
|
|
2 4 5 6 8 10
|
0.8500
|
1 4 5 6 8 10
|
0.7778
|
|
|
|
|
|
|
2 3 4 5 7 8 10
|
0.8000
|
1 2 3 4 6 8 9
|
0.7611
|
|
2 3 4 5 6 8 9
|
0.8000
|
1 4 6 7 8 9 10
|
0.7611
|
|
4 5 6 7 8 9 10
|
0.8056
|
3 4 5 6 7 8 10
|
0.7611
|
|
2 3 4 6 7 9 10
|
0.8083
|
3 4 5 6 8 9 10
|
0.7667
|
|
2 4 5 7 8 9 10
|
0.8083
|
2 4 5 6 7 8 10
|
0.7694
|
|
2 3 4 5 6 8 9
|
0.8111
|
1 3 4 5 6 7 8
|
0.7694
|
|
3 4 5 6 7 8 10
|
0.8278
|
1 2 3 4 5 6 8
|
0.7722
|
|
2 3 4 5 6 7 10
|
0.8306
|
1 4 5 6 7 8 10
|
0.7750
|
|
2 4 5 6 7 8 10
|
0.8389
|
1 2 4 5 6 8 10
|
0.7778
|
|
2 3 4 5 6 8 10
|
0.8556
|
1 2 4 5 6 7 8
|
0.7806
|
|
|
|
|
|
|
2 3 4 5 6 7 9 10
|
0.7639
|
1 3 4 6 7 8 9 10
|
0.7639
|
|
1 2 3 5 6 7 8 10
|
0.7694
|
1 2 3 4 6 8 9 10
|
0.7667
|
|
2 3 4 5 6 7 8 9
|
0.7750
|
2 3 4 6 7 8 9 10
|
0.7667
|
|
2 3 4 5 7 8 9 10
|
0.7778
|
3 4 5 6 7 8 9 10
|
0.7694
|
|
3 4 5 6 7 8 9 10
|
0.7833
|
1 2 4 6 7 8 9 10
|
0.7694
|
|
1 2 3 4 5 6 7 10
|
0.7889
|
1 3 4 5 6 7 8 9
|
0.7750
|
|
1 2 3 4 5 7 8 10
|
0.7889
|
2 3 4 5 6 7 8 10
|
0.7750
|
|
2 4 5 6 7 8 9 10
|
0.8028
|
1 2 4 5 6 7 8 10
|
0.7778
|
|
2 3 4 5 6 7 8 10
|
0.8167
|
1 3 4 5 6 7 8 10
|
0.7778
|
|
2 3 4 5 6 8 9 10
|
0.8222
|
1 2 3 4 5 6 7 8
|
0.7806
|
|
|
|
|
|
|
1 2 3 4 6 7 8 9 10
|
0.7194
|
1 2 3 5 6 7 8 9 10
|
0.7111
|
|
1 2 3 5 6 7 8 9 10
|
0.7278
|
1 2 3 4 5 7 8 9 10
|
0.7333
|
|
1 2 3 4 5 6 7 9 10
|
0.7333
|
1 2 3 4 5 6 7 9 10
|
0.7333
|
|
1 2 3 4 5 6 7 8 9
|
0.7361
|
1 2 3 4 5 6 8 9 10
|
0.7583
|
|
1 2 3 4 5 7 8 9 10
|
0.7389
|
1 2 4 5 6 7 8 9 10
|
0.7611
|
|
1 3 4 5 6 7 8 9 10
|
0.7444
|
1 2 3 4 6 7 8 9 10
|
0.7694
|
|
1 2 3 4 5 6 8 9 10
|
0.7583
|
2 3 4 5 6 7 8 9 10
|
0.7722
|
|
1 2 4 5 6 7 8 9 10
|
0.7639
|
1 2 3 4 5 6 7 8 9
|
0.7722
|
|
2 3 4 5 6 7 8 9 10
|
0.7806
|
1 2 3 4 5 6 7 8 10
|
0.7722
|
|
1 2 3 4 5 6 7 8 10
|
0.7889
|
1 3 4 5 6 7 8 9 10
|
0.7750
|
|
|
|
|
|
|
1
2 3 4 5 6 7 8 9 10
|
0.7472
|
1 2 3 4 5 6 7 8 9 10
|
0.7667
|
|
Figure
6: Tablature of 10 most accurate sensor combinations for each
quantity of sensors
|
Conclusions
and Future Work
These
preliminary results show that a wearable thermostat has the
possibility of being accurate enough to regulate a building's
ventilation system for a user's comfort. Although the system only
reached a maximum accuracy of 85%, further work which took into
account the time series data could possibly improve upon this. Also,
gains could be made by changing the voting algorithm for the
K-Nearest Neighbor algorithm. Since the human body works to regulate
its own temperature, it is more likely that a user will be 'neutral'
rather than 'hot' or 'cold', so perhaps the algorithm should favor
'neutral' classification.