Data analysis
This section describes and illustrated the data set used in the project, as well as the features that were used to describe and classify the data. We highlight the most significant problems that we encountered during the initial phase of the project and describe how we solved and got around them.
Data distribution
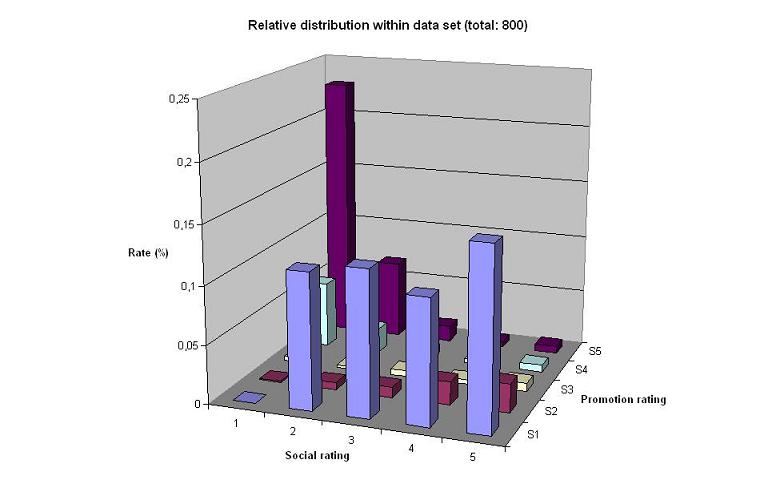
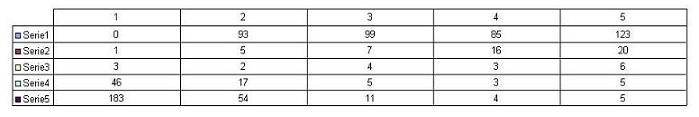
This graph illustrates the distribution of the 800 data points used in this project. As you can see the distribution is rather uneven, with high number of [1,5]-profiles (low social, high promotion) and [2:5, 1] (social 2, 3, 4 or 5,low promotion). The large quantity of [1,5]-profiles is a direct consequence of the way in which we picked out the 400 adds used in the project, since we since we specifically looked for profiles that we thought were straightforward.
Further, we divided the data into 600 training data points and 200 testing data points. The graphs below, illustrate the absolute distribution within each data set.
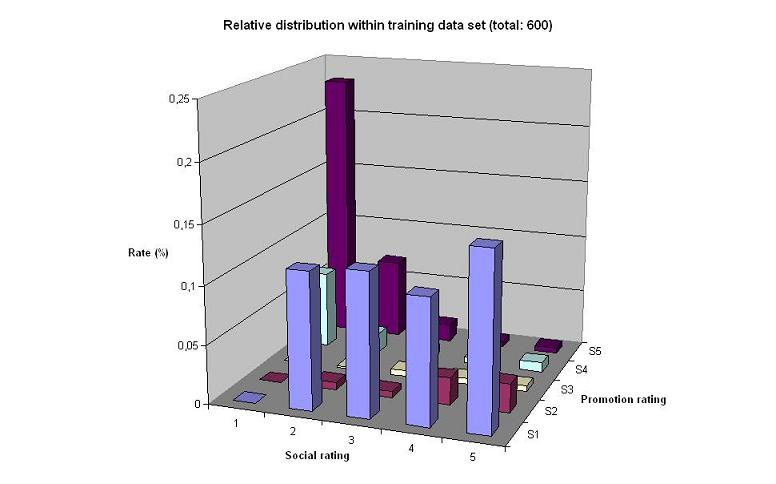
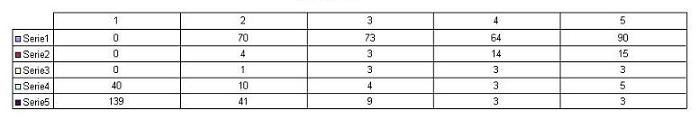

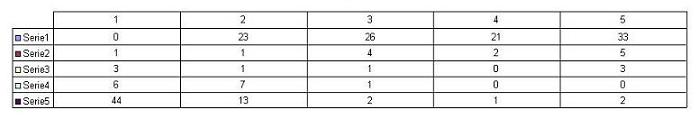
The charts above show that the distribution between the different data sets are fairly even. However, as pointed out before, the within-distribution is very uneven.
Feature analysis # 1
The next step in the project involved choosing features. After having labeled some 2000 profiles, we had some ideas regarding which features might be significant in the classification process. We focused on "low-level" (content-based) features that easily could be extracted from the html code of the profiles. Below is a list of the original set of features, as well as the data type of each feature.
| FEATURE | DATA TYPE |
| number of friends | integer |
| number of YouTube movies | integer |
| number of personal details | integer |
| number of comments | integer |
| number of "thanks for the add" in the comments | integer |
| number of surveys | integer |
| status | text |
| children | text |
| number of "I", "I'm", "me", "my" (first person) | integer |
| number of "we", "our", "he", "she" (second/third person) | integer | missing image | boolean |
| mp3 player | boolean |
| static url | boolean |
| school information | boolean |
| blurbs | boolean |
| customized page | boolean |
| network information | boolean |
| company information | boolean |
| blogs | boolean |