The ‘Crit Day’ Study
Yadid
Ayzenberg and Brian D. Mayton
Abstract. We set out to characterize skin
conductance changes as a response to public speaking. A group of 11 graduate
students participated in the study. These students were presenting their thesis
proposals to the faculty and other graduate students on a given day. Each
participant was given two wristband sensors. Each of the wristbands measured electrodermal activity, skin temperature and 3-axis accelerometery.
The participants were required to wear the sensors for 72 hours. In
addition, they were required to submit daily surveys at the end of each day.
The presentations were videotaped.
1.
Introduction
Public speaking
is often associated with high levels of stress and anxiety. Many individuals
fear being in the spotlight, being the center of attention, and the possibility
of standing on stage and forgetting what they meant to say. Additional elements
that may add to the anxiety are the possibility of being asked questions that
they are not prepared to answer. We set out to characterize the skin
conductance changes related to public speaking. Would it be possible to find a
correlation between speakers perceived stress levels and their physiological
response? Were the levels of stress highest before, during or after a talk? Were
the physiological responses of individuals that perceived themselves as very
stressed higher than the ones of those that perceived themselves as calm?
To gain insight
into the answers to these questions, we conducted a study and collected a
dataset including electrodermal activity (EDA) and survey
responses from 11 participants for several days around a stressful public
speaking event. In contrast to most
studies concerned with EDA data, we also collected this data from both wrists
for the duration of the study in an attempt to better understand what might
cause an asymmetric EDA response.
This paper is
organized as follows. Section 2 reviews previous studies on the subject of this
work. Section 3 provides details about the experiment. Section 4 presents the resulting
data set. Section 5 provides results and analysis.
2. Previous Work
It is possible
to measure changes in stress level by using electro dermal activity sensors. Our
“fight-or-flight” response that is controlled by the sympathetic nervous system
is heightened under stressful situations. The sub-dermal sweat glands’ activity,
which is controlled by the sympathetic nervous system (SNS), can be measured using
biosensors that are placed on the wrist and measure skin conductivity. Boucsein showed that skin conductance is highly correlated
to changes in sweat gland activity. Work done by Setz
et al. showed that it is possible to distinguish between cognitive load and
stress in electrodermal activity. By using EDA peak height and the instantaneous peak rate it is possible
to determine the stress level of a person.
Dimberg et al. found that subjects that possessed a public speaking
fear reacted with increased skin conductance activity when exposed to social
stimuli compared to low-fear subjects.
3. Experiment
Each year, the
MIT Media Lab organizes an event in which second year master's students present
their thesis proposal to all of faculty, students, and researchers. Each
proposal is evaluated in terms of depth, originality, and contribution. The
purpose of these presentations is twofold. The first is that the student will
receive constructive feedback on the proposed work. The second is that it compels the
students to spend time to explore possible research topics while constraining
their schedule. All master’s students are required to participate in a thesis
preparation seminar that will aid them in solidifying their ideas. At the
beginning of this seminar, the students are told of the importance of their
‘Crit Day’ performance that will be a factor that weighs
heavily in their Ph.D. application. Naturally, this adds significant
levels of stress to the students who realize that this speaking event may
determine the future of their academic career.
We decided that ‘Crit
Day’ was a valuable opportunity to measure the physiological effects of public
speaking.
3.1. Study Design
We recruited 11
graduate students, 8 males and 3 females, who were designated to present on ‘Crit
Day’. The youngest was aged 23, the oldest was aged 27 and the mean age was
24.6 (SD=1.2). The students would receive compensation in return for their participation
in the study. We made sure beforehand that none of the participants were
taking medication that could potentially have an arousing or calming affect, or
ADHD medication.
Before the study began, we asked the participants to report
their perceived level of stress during the last month. We used the Perceived
Stress Scale (PSS) as defined by Cohen et al., which is the most widely used
psychological instrument for measuring the perception of stress.
It is a measure of the degree to which circumstances in
one’s life are considered as stressful.
Items were designed to determine how unpredictable, uncontrollable, and
overloaded subjects find their lives to be.
During the three days of the study, we requested the
participants to report their daily perceived stress
levels at the end of each day. We
used the Daily Stress Inventory (DSI) as defined by Brantley et al., which
is a psychometrically sound self-report instrument for the daily assessment of
the sources and the individualized effect of relatively minor stressful events.
It was designed to evaluate causes of stress that are not typically evaluated
by major life-event scales. We add 4 additional questions to the standard DSI
survey:
1.
If something that was unexpected or caused you a great deal of stress, please
note the approximate time and duration of the event.
2.
On a scale of 0=time seemed to take forever, to 4=time
seemed to fly by, how would you say your day felt?
3.
On a scale of 0=felt poorly prepared to 4=felt very
prepared, how well prepared do you feel you were for today's events?
4.
This question mostly applies to ‘Crit Day’ (Nov 14): On a scale of 0=unfair to 4=fair, in your opinion, how fair were the
questions you were asked today?
The goal of question number 1 was to collect data that would
be correlated to changes of the participants skin conductance. We hypothesized
that unexpected events would cause a notable increase in skin conductance
immediately following the event. We also collected similar data by performing
exit interviews upon the completion of the study. However, since some time had
passed from the occurrence of the events to the time of the interview, the
results of these interviews may be biased.
We asked question
2 in order to find whether perceived stress had an impact on the perception of
time duration. We hypothesized that the stringent deadline and sense of urgency
would shorten the perceived duration of time, and that a day after the
presentation, time would be perceived as having a longer duration.
Question 3 was
asked in order to asses if the participants felt that
they were well prepared. We hypothesized that well prepared participant would
have a lower level of perceived stress and that this would
also be evident in their skin conductance.
We asked
question 4 to assess whether the participant felt in control during the
presentation and whether they thought that they were asked fair questions. We
hypothesized that during the question phase, participants who believed that
they were asked “unfair” question would exhibit this physiologically as well.
3.2. Data Collection.
We collected the
following data during the study:
1.
Skin
conductance, skin temperature, and 3-axis accelerometer – we used the Affectiva QTM wristband sensor. The data was
recorded at a sampling rate of 8 Hz, and was recorded using dry Ag-AgCl electrodes. Each participant received a pair of
sensors, one for each wrist, so we could collect bi-lateral data. Each sensor
had a label that was used to note the participant's id and whether the sensor
was to be placed on the left or right wrist. The participants were asked to
wear the sensors for 72 hours starting on the morning of the day before their
presentation.
2.
Self-report
measures – each participant was asked to fill in a PSS survey 2 days
prior to the start of the study. During the study, participants were required
to fill in a DSI survey at the end of each day.
3.
In
addition, we interviewed each participant a few days after the end of the
measurements. During those interviews, we asked the participants to describe
their experiences during the 72 hours. We asked them to note any unexpected
events or events that caused them a great deal of anxiety or emotional strain.
4.
Video
– during the presentations we recorded a video of the participants. In
some cases, we also recorded some of the participant's post-presentation
question sessions.
3.2.2 IT Infrastructure and tools
For participant
registration and conducting the surveys, we built custom Python-based web
software that ran on a server in the lab. The participants could access the
surveys by using a web browser from any location. The tool presented the surveys to the
participants and collected their responses.
A MySQL server
was used to store the survey responses. At the end of the study
we exported all the results from the database into an Excel sheet.
The Q sensor
data was downloaded from each unit and stored in a dedicated server, along with
the survey responses and the video files.
For the signal processing we used MATLAB. We built a Python tool to convert
all of the Q sensor data into MATLAB file format and filter out noise.
We also used a
tool written in Processing by Miriam Zisook that
enabled us to rapidly detect cases of asymmetry.
3.2.1 Privacy Measures
In order to
protect the privacy of the participants, several measures were put in place.
When the participants logged into the web system for the first time, they were
randomly allocated a 5-digit PIN number. They were asked to use this number
every time they logged into the system. In addition, they were asked to write
this number on the labels of the sensors that they were given. This enabled us
to correlate between the subjects sensor reading and their self-reports.
Results and Discussion
We have
collected the following data set:
|
PSS |
11
participants (all) |
|
DSI |
·
7
recipients filled in all surveys ·
3
participants filled in the first 2 DSI surveys but not the 3rd one
·
1 participant
did not fill in any of the DSI surveys |
|
Video
and audio during presentation |
10
participants |
|
Interviews |
11
participants (all) |
We calculated
a PSS score per participant. The score is obtained by reversing the responses
of the negatively stated items (e.g., 0 = 4, 1 = 3, 2 = 2, 3 = 1 & 4 = 0)
to the four positively stated items (items 4, 5, 7, & 8) and then summing
across all scale items. This score represented the perceived level of stress
during the last month. The average PSS that was collected for a large
population was 12.1 (SD=5.9) for males and 13.7 (SD=6.6) for females.
We calculated DSI
scores for each participant. Three daily scores are derived for each
individual: (1) the number of events that are endorsed as having occurred (Freq) (2) the sum of the total of the impact rating of
these events (Sum), and (3) the average impact rating of the events (sum
divided by the number of events) (Avg).
The table
below shows the PSS and DSI scores for each participant.
|
Day 1 |
Day 2 |
Day 3 |
||||||||
|
PIN |
PSS Sums |
Freq |
Sums |
Avg |
Freq |
Sum |
Avg |
Freq |
Sum |
Avg |
|
54604 |
25 |
16 |
50 |
3.125 |
21 |
45 |
2.143 |
|||
|
75049 |
22 |
14 |
62 |
4.429 |
20 |
67 |
3.350 |
17 |
34 |
2.000 |
|
34600 |
21 |
25 |
80 |
3.200 |
29 |
122 |
4.207 |
|||
|
05972 |
19 |
15 |
46 |
3.067 |
9 |
25 |
2.778 |
11 |
34 |
3.091 |
|
18372 |
17 |
13 |
31 |
2.385 |
17 |
55 |
3.235 |
15 |
50 |
3.333 |
|
57607 |
17 |
19 |
73 |
3.842 |
14 |
48 |
3.429 |
|||
|
41965 |
10 |
31 |
51 |
1.645 |
23 |
47 |
2.043 |
21 |
63 |
3.000 |
|
36237 |
9 |
13 |
63 |
4.846 |
17 |
55 |
3.235 |
4 |
9 |
2.250 |
|
13113 |
9 |
16 |
28 |
1.750 |
16 |
29 |
1.813 |
16 |
23 |
1.438 |
|
20052 |
8 |
10 |
26 |
2.600 |
8 |
16 |
2.000 |
0 |
0 |
0.000 |
|
|
|
|
|
|
|
|
|
|
|
|
Table 1 PSS and DSI scores
The first
result is that according to the DSI the mean perceived stress across all participants
was highest on the night before ‘Crit Day’ (3.09) and lowest on the night of
the day after ‘Crit Day’ (2.16). On the night of ‘Crit Day’
the perceived stress was in between the two (3.09). The average DSI measured
for a large population in Cohen’s was 2.36 (SD=0.82) for males and 2.68 for
females (SD=0.97)
We assumed
that there should be a correlation between the PSS and the first DSI as they
were submitted within the same time frame. Initially we found that the
correlation between them was 0.3122, which was statistically not significant.
After viewing the plot we noticed that a single
subject was an outlier. Further investigation reveled that the participant had a argument with his partner just before filling the survey.
We suspected this resulted in a biased score. After removing this subject we found that the correlation between the PSS and
first DSI was 0.71, which was statistically significant (p<0.05).
The DSI also
revealed that participants perceived time as passing quickly the day before
‘Crit Day’ (mean = 2.4, SD = 1.5), and passing slower during ‘Crit Day’ (mean =
2.33, mean = 1.21), and yet slower the day after (mean = 1.83, SD = 1.17).
We also found
that most participants felt that the questions they were asked were fair (mean
= 3.8, SD = 0.42).
Initially,
after viewing the EDA signals we found that some of the samples were extremely
noisy. We estimate that the reason for this is loose contact between the sensor
and the skin. We applied an infinite impulse response low pass filter
(exponential smoothing) with different coefficients for rising signals and
falling signals (alpha rise = 0.5, alpha fall = 0.95). This filter is an attempt to reduce
artifacts where the signal briefly but sharply drops due to poor contact with
the skin, which appeared in several subjects' data. We implemented this filter
in Python.
The first
result that arose from analyzing the EDA signals was that there is a notable
difference within each subject between the presentation and the questions
phase. In the question phase, the EDA level was higher, and there were more
peaks per second. This is true
across all participants. We conclude that either the fear of being asked a
difficult question and evaluated by others, or just being
asked a question results in a heightened physiological response
|
|
|
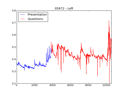
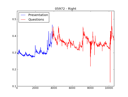
Above can be seen
the left and right EDA signals for two subjects. The EDA during the
presentation is colored in blue, and the EDA during the question phase is
colored in red.
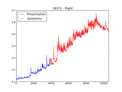
We analyzed all
of the EDA signals for asymmetry. 2 participants out
of 11 exhibited temporary asymmetry in their EDA. There was no correlation
between perceived stress ratings (on DSI and PSS) and asymmetry in EDA. The
snapshot below shows asymmetry that begins just prior to the participant’s
presentation and lasts throughout.

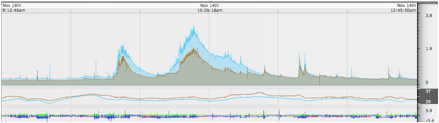
Figure 1 EDA Asymmetry (18372)
during presentation
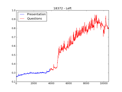
The second EDA
signal also shows asymmetry, as the participant is about to start his
presentation.

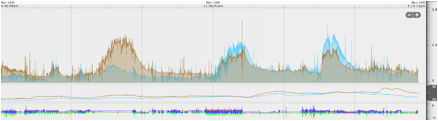
Figure 2 EDA Asymmetry (57607)
during presentation
Finally, we tried to count peaks and correlate them with the percieved
stress levels. However, we could not find any significant results. We suspect that our facility for
counting peaks (the findpeaks function in MATLAB's
signal processing toolkit) is confounded by noise in the data from poor contact
with the skin, which varies greatly from participant to participant and, to a
lesser extent, over the course of the day (perhaps due to participants
re-adjusting the fit of the wristband.)
A more careful definition of what constitutes a 'peak' feature in EDA
data and is more robust to noise may yield better results.
|
PIN |
13 Nov Left |
13 Nov
Right |
14 Nov
Left |
14 Nov
Right |
15 Nov Left |
15 Nov Right |
|
5972 |
0.108931 |
0.042647 |
0.097395 |
0.091768 |
0.105573 |
0.091005 |
|
13113 |
0.006115 |
0.016222 |
0.115815 |
0.034953 |
0.112331 |
0.029933 |
|
18372 |
0.016222 |
0.00873 |
0.002861 |
0.031462 |
0.014959 |
0.055563 |
|
20052 |
0.09649 |
0.120339 |
0.013636 |
0.018172 |
||
|
34600 |
0.038732 |
0.245188 |
0.069173 |
0.106703 |
0.218192 |
0.086264 |
|
36237 |
0.036325 |
0.013221 |
0.015145 |
0.00938 |
0.033767 |
0.028134 |
|
41965 |
0.239856 |
0.206557 |
0.403685 |
0.236872 |
0.048534 |
0.032602 |
|
54604 |
2.868826 |
0.163433 |
0.010651 |
0.008393 |
0.562887 |
0.40959 |
|
57607 |
0.140879 |
0.238506 |
0.167272 |
0.438723 |
0.083897 |
0.124151 |
|
75049 |
0.119898 |
0.070873 |
0.269948 |
0.485653 |
0.129117 |
|
|
91405 |
0.113824 |
0.110514 |
0.125519 |
0.100129 |
0.148339 |
0.545966 |
|
Mean |
0.344190727 |
0.112384545 |
0.1021152 |
0.122409364 |
0.1814132 |
0.1532325 |
Table 2
Number of Peaks per Minute using findpeaks and
threshold of 0.001
Conclusion
We have
collected a large dataset, consisting of bilateral EDA data, initial Perceived
Stress Scale (PSS) responses, and daily Daily Stress
Inventory (DSI) survey responses.
Preliminary analysis shows some patterns that we expected, such as
greater activation during Q&A after the presentation (which cannot be
rehearsed) and less during the presentation (which participants likely
rehearsed several times and felt prepared.) The dataset also contains several events
where the participants' EDA is asymmetric, some of which we have associated
with participants' descriptions of events at those times.
The preliminary
analysis that we have done merely scratches the surface. We plan to continue investigating and to
make the de-identified data available to other researchers for further study.
References
Boucsein, W.: Electrodermal
Activity. Plenum Press, New York (1992)
Brantley P.J.,
Waggoner C.D., Jones G.N., Rappaport N.B.: A daily stress inventory: Development,
reliability, and validity. J Behav Med;10:61–731, (1987)
Cacioppo, J.T., Tassinary,
L.G., Berntson, G.G.: Handbook of Psychophysiology.
Cambridge
University Press, Cambridge (2000)
Cohen, S; Kamarck T, Mermelstein .: "A global measure of perceived stress". Journal of Health and Social Behavior 24 (4): 385–396.
PMID 6668417, R (December 1983)
Cohen, S. and
Williamson, G.: Perceived Stress in
a Probability Sample of the United States, The Social Psychology of Health, Newbury
Park, CA: Sage (1988)
Dimberg, U., Fredrikson,
M. and Lundquist, O.: Autonomic reactions to social and neutral stimuli in
subjects high and low in public speaking fear, Journal Biological Psychology,
Volume 23(3), p223 (1986).
Lykken, D.T., Venables,
P.H.: Direct measurement of skin conductance: A proposal
for standarization.
Psychophysiology 8(5), 656–672 (1971)
Mundy-Castle,
A.C., McKiever, B.L.: The psychophysiological
significance of the
galvanic skin response. Experimental Psychology
46(1), 15–24 (1953)
Poh, M., Swenson, N., Picard, R.: A wearable
sensor for unobtrusive, long-term
assessment of electrodermal
activity. IEEE Trans. Biomed. Eng. 57(5), 1243–1252 (2010)
Setz, C., Arnrich,
B., Schumm, J., La Marca,
R., Troster, G., Ehlert, U.: Discriminating stress from cognitive load using a
wearable eda device. IEEE Transactions on Information
Technology in Biomedicine 14(2), 410–417 (2010)