Nicole’s Experiments with Textile Sensors
by N.Tari
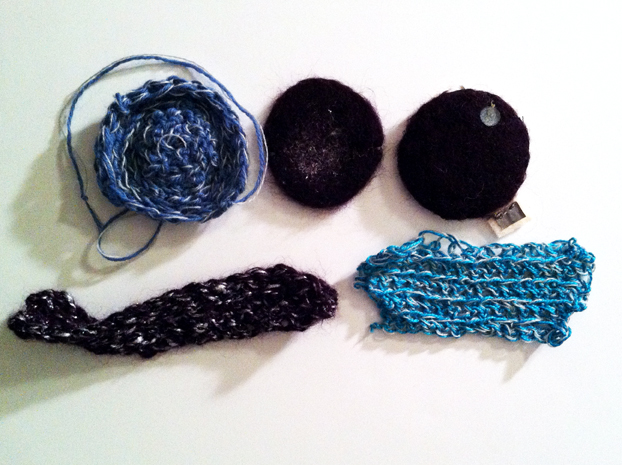
Process: I created several stretch and pressure sensors for this project. Each was constructed differently from different materials and as a result have a range of sensitivities and uses. I started by using the conductive yarn I spun by hand and crocheting it into a strip. The yarn is resistant because of its mixture of aluminum and wool fibers. The next sensor I created in a similar fashion by crocheting a cotton yarn with a conductive yarn with a higher resistance. For both of these sensors, changes in resistance are created and measured by stretching the structure bring the resistance down. After completing the two stretch sensors I started to experiment with needle felting. I started by creating a felt that in the center was a combination of aluminum fibers and wool. This functions similarly to the stretch sensor made from the hand spun yarn. As the sensor is pressed the resistance drops. Pressure sensor two is constructed out of conductive yarn and traditional yarn to create a higher resistance. This is similar the the sensors Heidi and I built for our cell phone pouches. The yarn was crocheted together in a circle. The last sensor I fabricated, inspired by Hannah’s bend sensors, is the most complex. Here I used two pieced of felt (one created by hand), conductive thread, very small pieces of conductive thread, and velostat to create the sensor. Here conductive thread is sewn into each half of the sensor attaching to a small piece of conductive fabric where the arduino can be attached. The the two pieces are places with the stitched facing each other crisscrossed with a piece of volostat in the center. When the sensor is pressed the velostat compresses and the resistance drops.
Programming: Initially I wanted to create a system that would allow me to compare the data for each sensor. I experimented with visual outputs and settled on a few. The first shows how the data is changing though a square that scales in size and changes position in reaction to the sensors behavior. After I completed this I wanted to be able to save the visual out put created with processing and use it to compare the behaviors. To enable this I created a graph that exports a PDF when the file is closed. When testing the sensors I tried to keep the timing of the pressure of stretching consistent. When looking at the graphs created the ranges for the sensors can be seen.
PROCESSING:
Visual Output:
import processing.serial.*;
import fullscreen.*;
SoftFullScreen fs;
Serial myPort; // The serial port
int xPos = 1; // horizontal position of the graph
void setup () {
//size(1024, 768);
size(screen.width, screen.height);
noCursor();
//fullscreen
fs = new SoftFullScreen(this);
//List all the available serial ports
println(Serial.list());
// I know that the first port in the serial list on my mac
// is always my Arduino, so I open Serial.list()[0].
// Open whatever port is the one you’re using.
myPort = new Serial(this, Serial.list()[0], 9600);
// don’t generate a serialEvent() unless you get a newline character:
myPort.bufferUntil(‘\n’);
// set inital background:
background(0);
}
void draw () {
// everything happens in the serialEvent()
}
void serialEvent (Serial myPort) {
// get the ASCII string:
String inString = myPort.readStringUntil(‘\n’);
if (inString != null) {
// trim off any whitespace:
inString = trim(inString);
// convert to an int and map to the screen height:
float inByte = float(inString);
inByte = map(inByte, 0, 1024, 0, height);
// draw the rect:
smooth();
background(255);
noStroke();
rect((inByte/2)+200, 300, inByte/2, inByte/2);
fill(#3EC0E3);
smooth();
println(inByte);
}
}
Graph with PDF Export:


