MAS622J Final Project - Aisha Walcott - Fall 2006
Introduction
Data
Features
Methods and Results
Conclusions
Feature Extraction
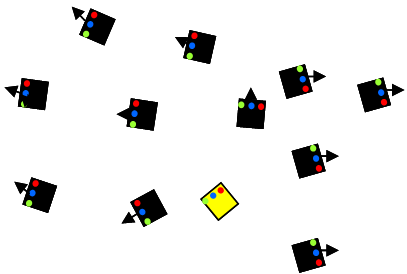
To determine our set of features, we first note that each data file is an instance of the Swarm. As the Swarm executes each behavior, they evenutally reach the intended goal state (eg. Bubble Sort) which is the steady state. There is a unique steady state for each behavior. Features are used to determine if and when the Swarm reaches a steady state. Each steady state/high level behvaior is defined by its own set of features. The figures below illustrate some of the features used for each behavior.
Figure
1: Example
Swarm Behavior Features

|
 |
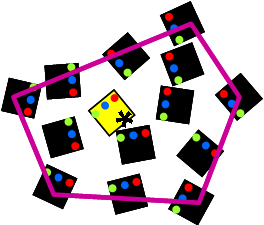 |
| Line
Fit : Determines how well the positions of the robots fit a
line. Used to find the slope of the line and the least squared error. |
Dot
Product To Source: Computes the dot product of the velocity vectors for
each robot and the vector to the source robot. |
Convex
Hull Density: Compute the ratio of the area of the robots that are
within the convecx hull of all the robot positions. The ratio is the
total area of the robots/ the area of the convex hull polygon. |
The Feature Vector
Fourteen features were defined from the data resulting in a 16-D feature vector. The features were primarily derived from the convex hull density feature, the line fit feature, the distance to source feature, and the dot product to source feature. These were calculated for each swarm instance at steady state. In addition, statistics such as the average and the variance were used in the feature vector.
x = [avg_density,
avg_pts,
avg_area,
avg_bots,
var_density,
var_pts,
var_area,
var_bots,
avg_slope,
avg_lsqerr,
var_slope,
var_lsqerr,
avg_dist,
var_dist,
avg_dotprod,
var_dotprod]