MAS622J Final Project - Aisha Walcott - Fall 2006
Introduction
Data
Features
Methods and Results
Conclusions
Three pattern recognition algorithms were used to classify the Swarm behaviors: k-Nearest Neighbor, Neural Networks, and Bayes Nets. There were not a large number of samples per behavior (approximately 20+ per behavior). Thus, 70% of the sample were used for training while the remaining were used for testing. This percentage was varied to compare the amount of training data required to get adequate results.
Here is an example matlab video of the Bubble Sort behavior over time.

k-Nearest Neighbor (kNN)
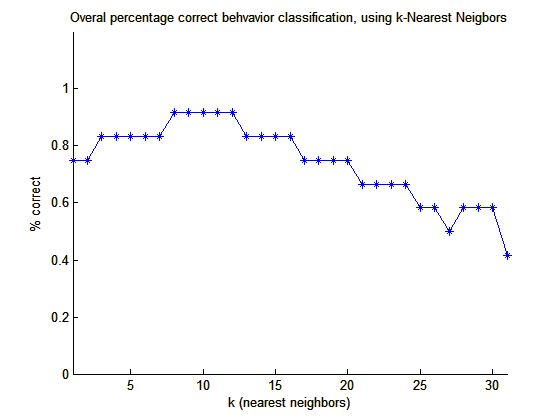
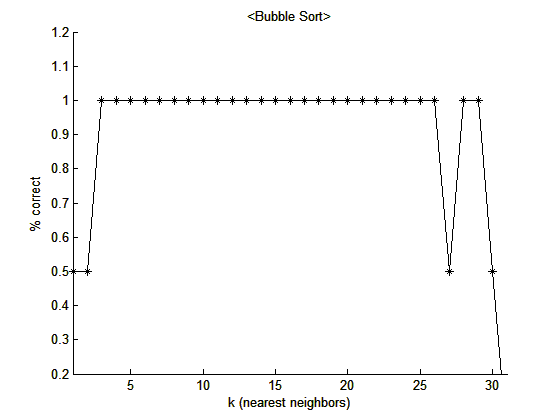
To test the kNN algorithm and tune if for accuracy, a range of k from 1 to 31, where ties for classifying a point were broken at random. Results are shown for the overall classification, that is the total correct out of all the test data. Additionally, results showing percent accuracy for classification of each behavior as it varies with k are described below. Please note, that the number of test samples for each behavior was small due to the amount of data provided.
Figure
1: Total Overall Correct Classification Results
 |
 |
The above graph shows that the best number of k (nearest neighbors) for overall accurate classification is between 9 and 13. This shows that increasing the k does not guarantee better classification results. The graph shows that the classification accuracy decreases as the number of k increases beyond approximately 15 neighbors. This may be a result of the number of the number of behaviors being classified. That is, when k increases many neighbors from all classes are included in the nearest neighbor range. Thus, there may only be one class that has slightly more neighbors in the range than another and as a results more samples are mis-classified.
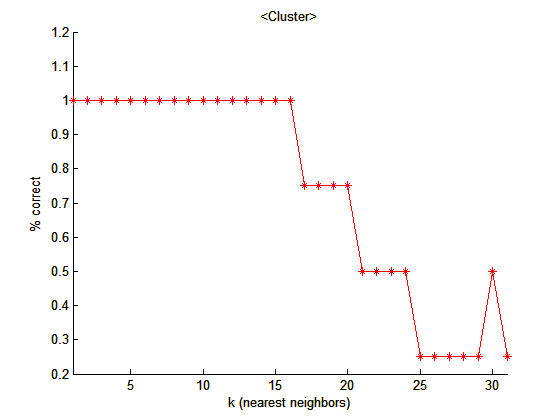
Figure
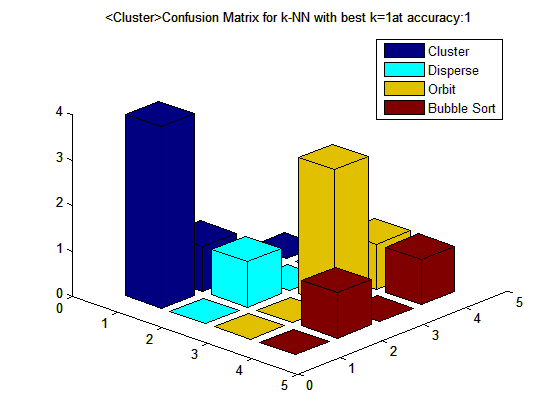
2: Classification results when Cluster was best classified
 |
|
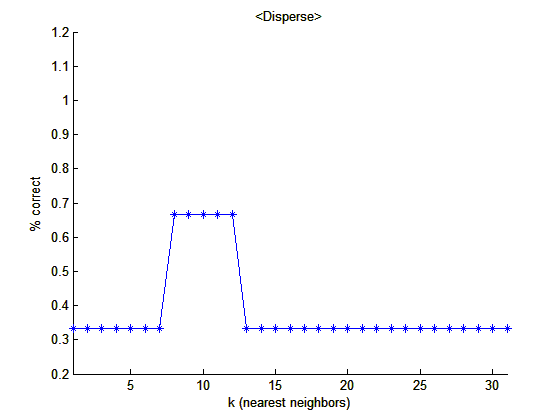
Figure
3: Classification results when Disperse was best classified
 |
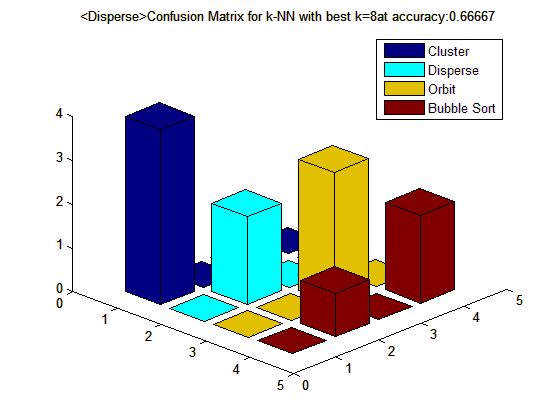 |
Unlike the other behaviors,
Disperse did not classify well overall. It reached only about 70%
classification and then dropped back again. This was not initially
expected because Disperse might be considered to be the opposite of
Cluster. Thus, if the features used are able to classify Cluster well,
then one might believe that Disperse would classify well too.
However, there are apparently additional features required to to
distinguish Disperse from the other behaviors. It's also possible that
a
dimensionality reduction technique such as PCA may improve the results,
by keeping only the "necessary" features.
Figure 4: Classification
results when Orbit was best classified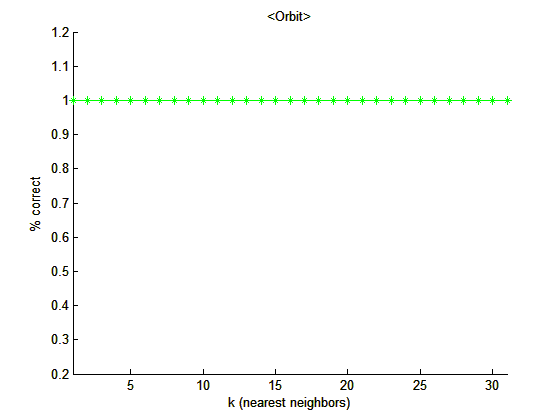 |
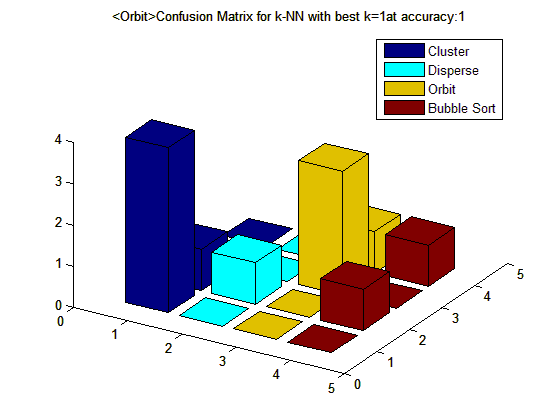 |
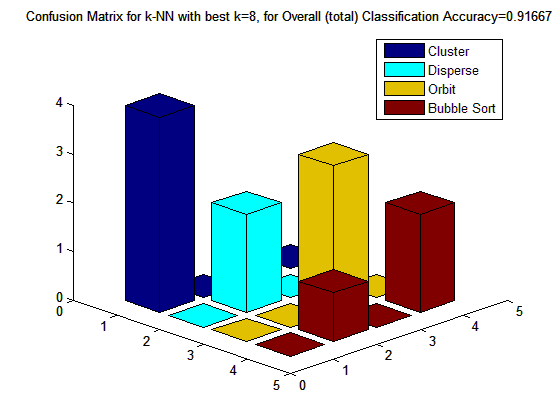
Classification of the orbit behavior went very well. More than likely this is a result of the minimal number of variety of samples for the Orbit behavior. Additionally, it's a very different behavior from the others, thus with the right set of features, such as those in the feature vector used, Orbit may be easily identified. Notice that Bubble Sort did not classify well for this value of k = 1, and it was misclassified as Orbit.
Figure
5: Classification results when Bubble Sort was best classified
 |
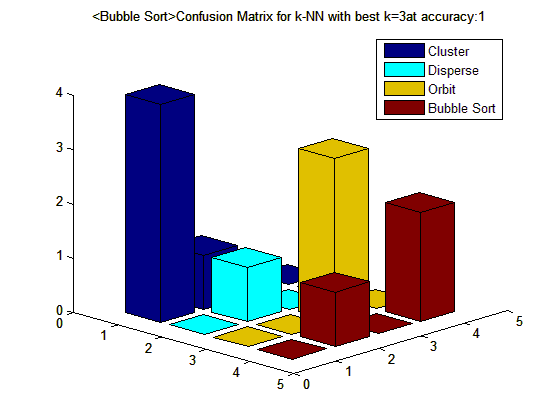 |
Like Orbit, Bubble Sort is also a very distinguishable behavior because the results is a line. A good set of features can be used to well describe Bubble Sort, which is most likely why it had accurate classification for most of the values of k.
The k-Nearest Neighbors results show that many of the best k values for each behavior and for the total overall classification were in the lower range values of k. This is likely a results of the small number of test samples, and the number of classes. To gain a better understanding of the true performance of kNN on classification of Swarm behaviors, one needs more samples of each behavior as well as a variety of samples for each behavior.
Neural Networks (NN)
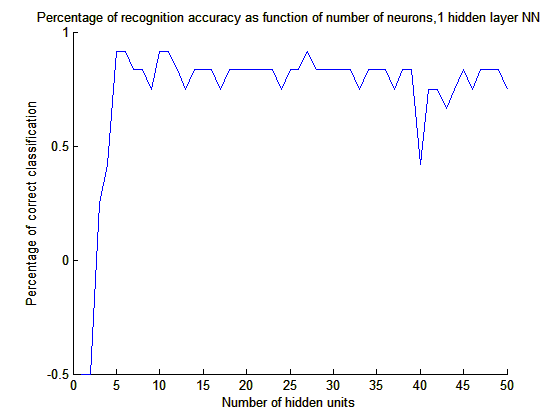
A single hidden layer and a two hidden layer neural network were trained. The single hidden layer NN was trained for a range of 1 to 50 hidden units (neurons). The best number of neurons was used to train the two-layer NN. A logsig function was used to to train the weights in the NN. Below are the results of the neural network classification.
Figure
6: Results for 1 hidden layer NN, with a range of neurons form 1 to 50.
 |
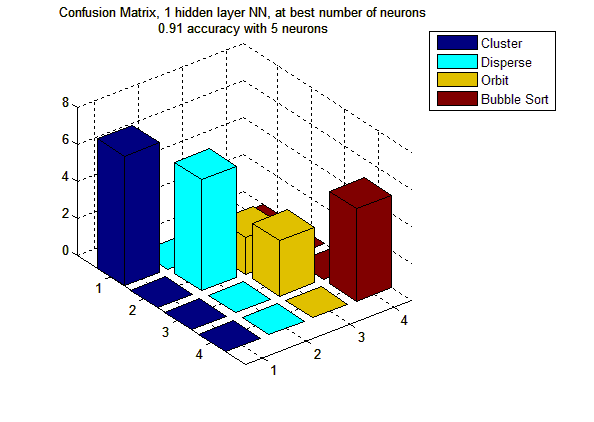 |
The above figure illustrates that a minimal number of neuron were required to achieve high classification results, 91%. This may be a bit misleading because there was not a large sample of testing data. Orbit, tended to not classify well using the NN when the other Swarm behaviors did classify well. This is also evident in the 2 hidden layer neural net below.
Figure 7: Confusion Matrix for 2 hidden layer NN, with 2 neurons.
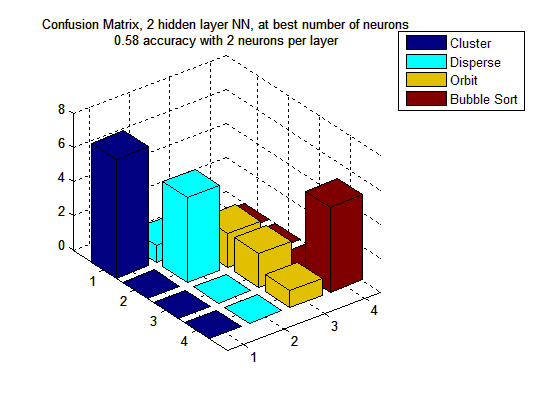 |
The above figure shows reasonable classification results, 58% using half of the best number of neurons from the hidden layer for each layer. This illustrates that there is level of increased complexity when increasing the number of hidden layers. To train the 2-layer NN it requires more than just knowledge of the best number of neurons provided by the single hidden layer NN.
Overall neural nets were somewhat inconsistent in their classification accuracy. In addition to the results shown above, a number of trials were done. In some trials the results were lower than 50% and in other trials the results were in the 90% range. There are a number of parameters one can tune in order to achieve accurate classification results.
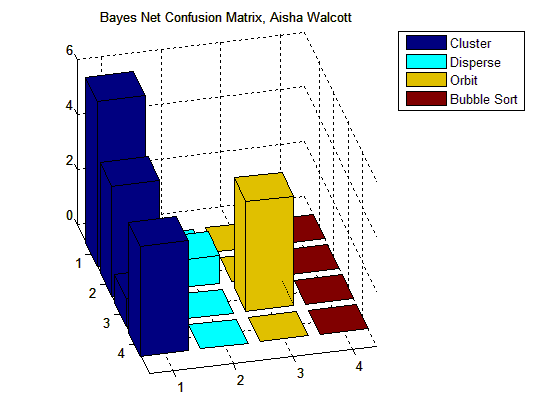
Bayes Nets
A Bayes net with a single node that classifies the behaviors with 16 features as inputs and 4 clsases as output was created. Two method were tried in order to discretize the real numbered feature data into discrete bins. The first technique was applying kmeans clustering along each feature dimension. The second technique was to equally divide the data up like a histogram. Both techniques resulted in similar odd-looking confusion matrices. Both techniques yielded resulst in which a number of behaviors were many of the behaviors were misclassified as Cluster, as shown in the figure below. The figure shows equal discrete bins with a total of 4 bins. The Bubble Sort behavior was misclassified all the time. These results may be due to the fact that a more specific technique needs to be applied when discretizing features.
Figure 8: Bayes net used to classify Swarm behaviors.
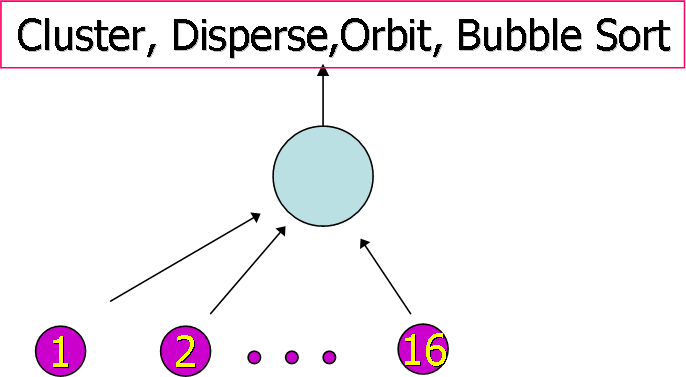
Figure 9: Confusion matrix for bayes net with 4 discrete elements.