Couples (Signal Synchronization)

I also wanted to look at whether the couples had synchronized EDA signals. In order to compare the signals, I removed the low-frequency (baseline) component from each signal because I wanted to examine synchronization between couples on the short time scale (order of seconds) rather than a long time scale (order of minutes). The baseline correlation between couples can be seen in the stories section.
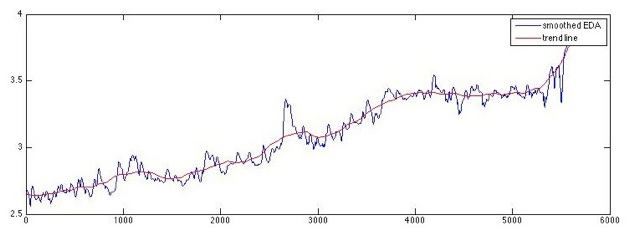
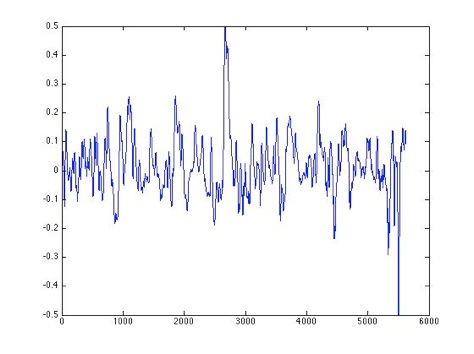
The baseline is calculated by taking the local linear regression over a neighborhood of 30 seconds. The baseline is then subtracted from the initial signal. The result is a graph that shows the individual peaks without the baseline. Finally, the data is normalized to the (-0.5, 0.5) range for easier visual comparison. Note this is a qualitative analysis only.
Here’s what it looks like in pictures. The first graph shows the initial EDA and the baseline (in red).
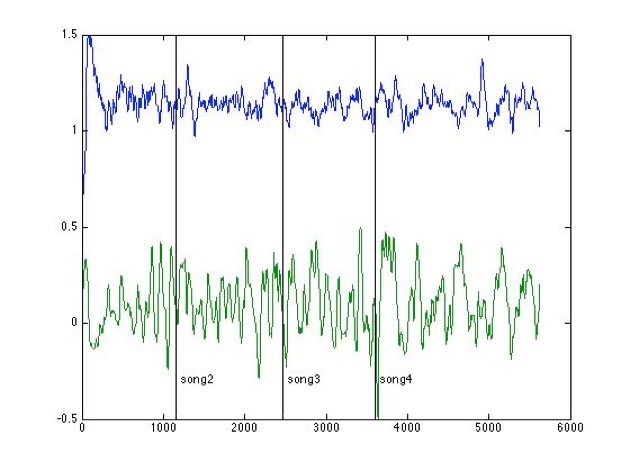
Couple #1:
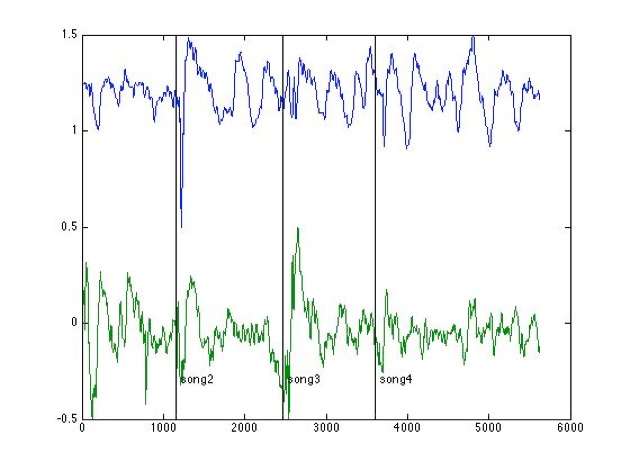
This couple dances together frequently.
(For this graph and all other graphs below, blue = leader, green = follower. The leader’s graph is shifted up to help with visual comparison.)
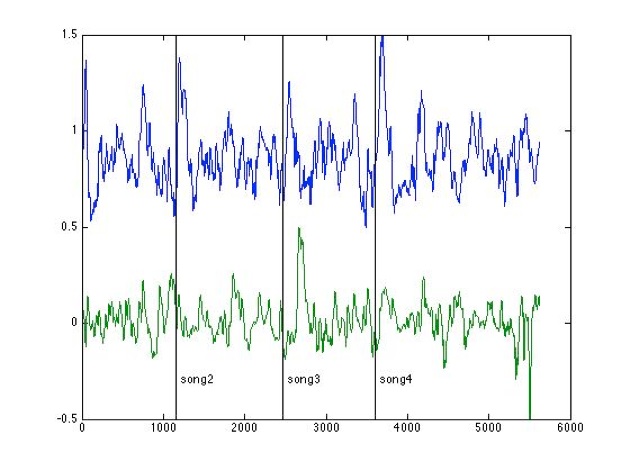
A visual inspection shows greater synchronization during songs 2 and 4 (especially song 2).
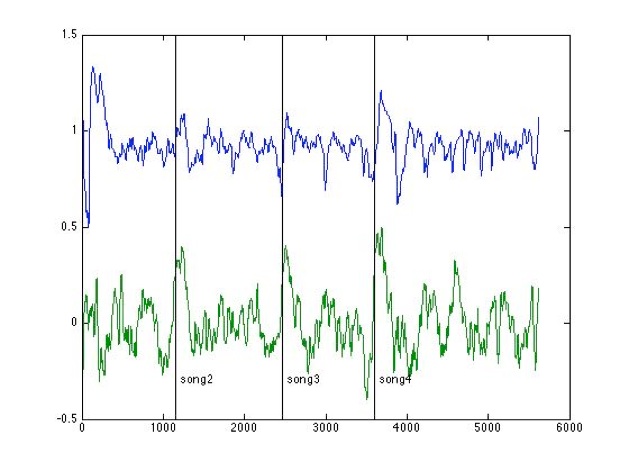
Couple #2:
This couple dances together very frequently.
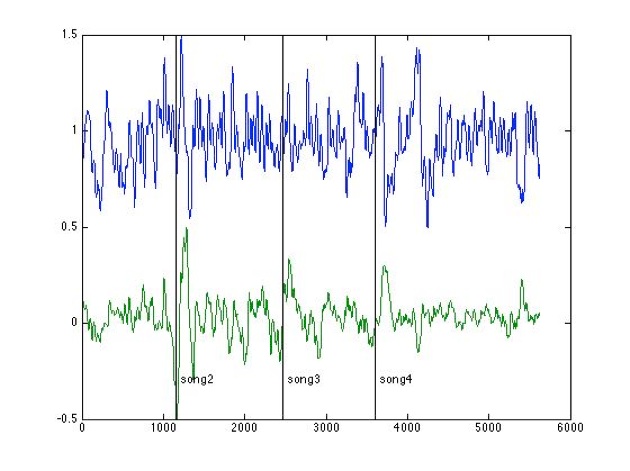
A visual inspection shows greater synchronization during songs 1 and 2 (again, especially song 2)
Couple #3:
This couple dances together very frequently.
Song 2 appears to be the most correlated, but it’s hard to tell.
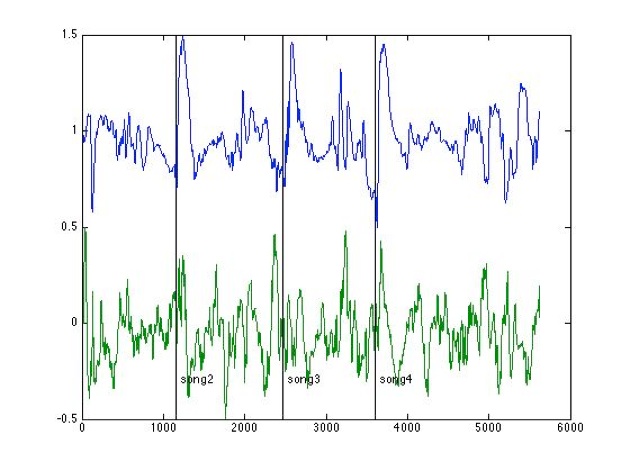
Couple #4:
This couple has never danced together before.
Songs 2 and 4 have the greatest correlation.
Couple #5:
This couple dances together very frequently.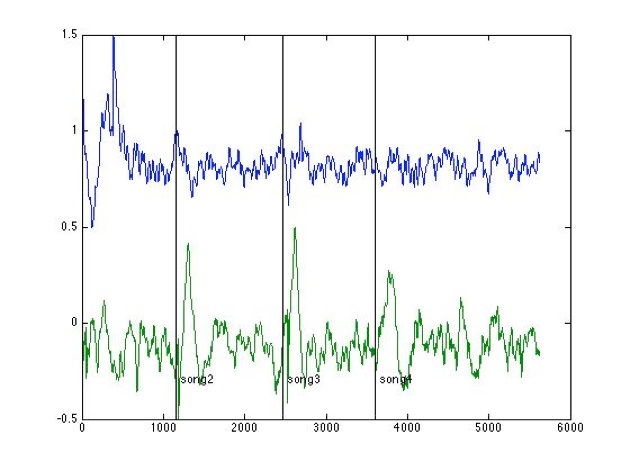
Song 3 has the greatest correlation.
Couple #6:
This couple dances together frequently.
Songs 2 and 3 appear to have the greatest correlation. The second major peak in song 3 happens around 1:27 in the song, when the theme is quite dramatically reintroduced.
Couple #7:
This couple dances together occasionally.
Songs 2 and 4 appear to have the greatest correlation.
Conclusion
It appears that there are certain places where peaks are likely to occur, for both the leader and follower. Do they correspond to significant places in the music (like I pointed out for couple #6)? This is explored in the Trends section.