Trends

Taking the Average
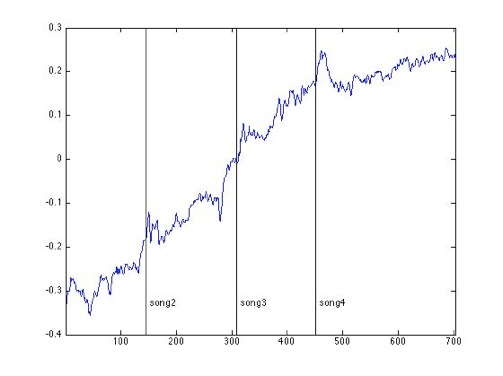
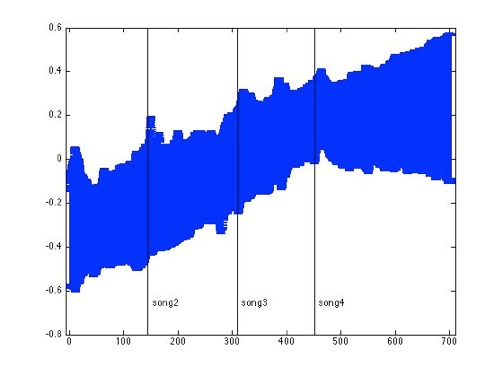
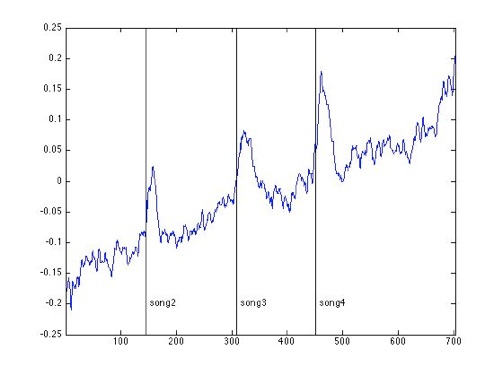
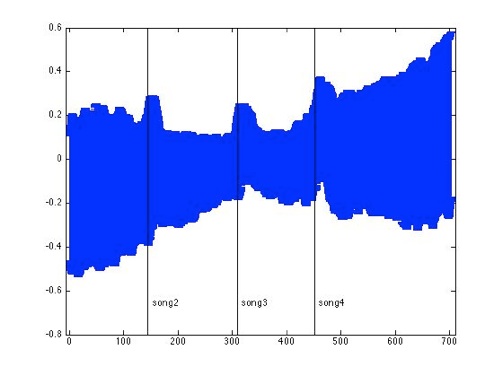
So what is the average EDA signal while dancing? I normalized each participant’s signal between -0.5 and 0.5, then calculated the mean and standard deviation for each condition (dancing alone vs. with partner).
Dancing Alone, Mean:
Dancing Alone, Mean + STD:
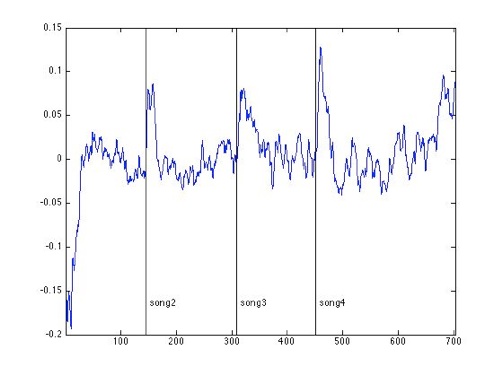
Dancing with Partner, Mean:
Dancing with Partner, Mean + STD:
Conclusion:
Look at those peaks! In both conditions, there are very clear peaks at the beginning of songs. This probably reflects the response to a new song. The peaks are especially clear in the dancing with partner condition, which could reflect the greater mental/physical change between dancing as one and separating from the embrace.
Out of curiosity, I separated the signals from the leaders and followers during the dancing with partner condition.
Leaders:
Followers:
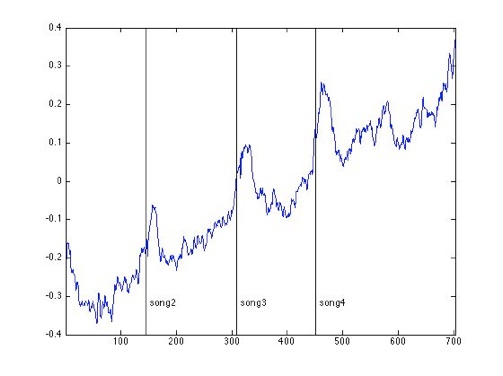
Two quick observations pop out.
1) The EDA baseline for leaders remains fairly stable, whereas the baseline for followers trends up at a constant rate.
2) The peak sizes are different. The followers’ signal has a peak at the beginning of song 1, where as leaders’ signal does not. In addition, the peak at the beginning of song 4 is greater than for other songs, especially for leaders’ signal. Are leaders more sensitive to (or stressed out by) novel music when they dance?
Now let’s make a context switch from average EDA levels to peak frequency. (In other words, let’s go from “what’s the EDA value at this point?” to “where do peaks occur?”)
Peak Onset Time
Can we find trends in the dancers’ peak onset times?
Using matlab’s findpeaks function, I juxtaposed all the participants’ peak locations for each song in both conditions. You can imagine a ballot system where each user can cast a ballot where there is a peak. The result looked like this:
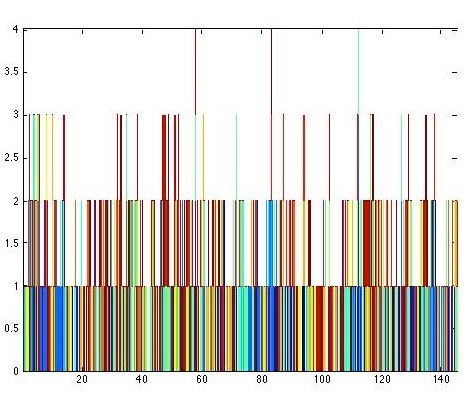
This is fine, but it doesn’t show the whole story since the same musical feature might trigger responses in different people that don’t happen to show up in the same 1/8 second interval. In response, I binned the data in 2 second intervals such that each bar contains the total number of peaks in that 2 second interval. Finally, I put in vertical lines to delineate the musical structure in each song.
The result looks like this:
(higher bar = higher number of peaks in that interval)

Musical Note: You can try listening along to the music while following the
graphs by clicking on the song title. The x-axis reflects time in seconds.
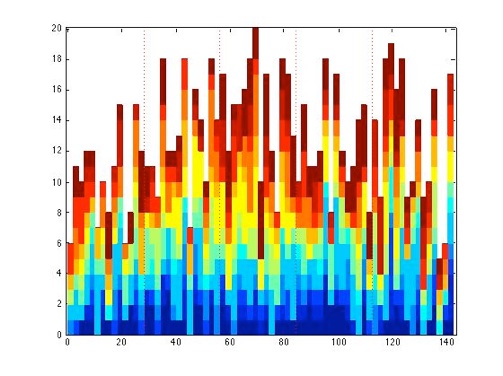
Song 1 (Carnaval De Mi Barrio):
Dancing Alone:
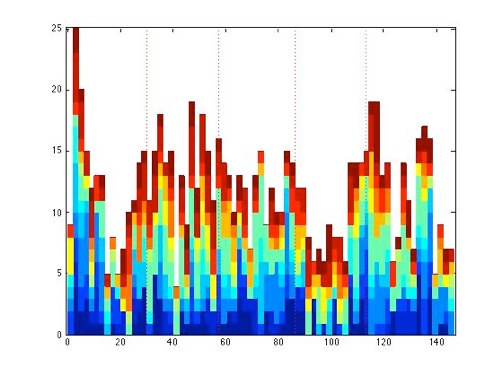
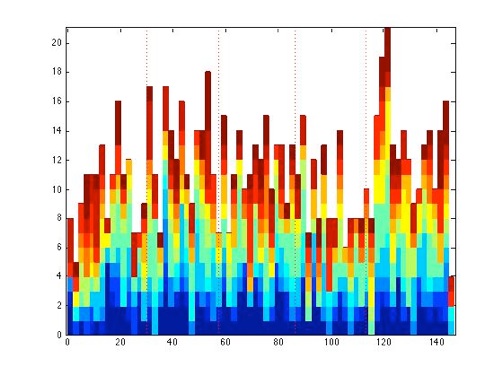
Both conditions show high number of peaks during chorus 1 and verse 3, with low number of peaks around chorus 2. The dancing with partner section especially shows a clear association between high peak count and verse 3.
For reference, here’s the musical structure of Carnaval De Mi Barrio :
0s - 29s verse 1 (instrumental)
30s - 56s chorus 1(instrumental)
57s - 85s verse 2 (vocal)
86s - 112s chorus 2 (vocal)
113 - 145s verse 3 (instrumental)
Song 2 (Nada):
Dancing Alone:
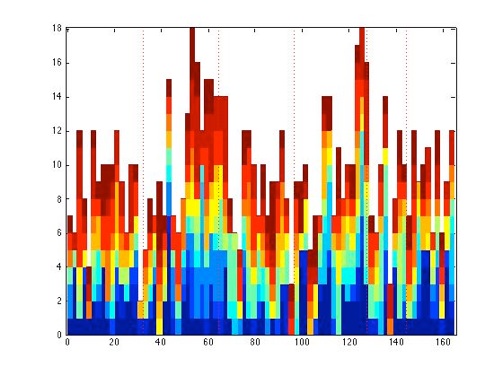
Dancing with Partner:
Dancing alone has two major peaks, one around chorus 1 and one around 130s (beginning of the final chorus). Dancing with partner has a more widespread distribution, but a noticeable dip around the middle of verse 1. A period of high peaks begins around chorus 1.
For reference, here’s the musical structure of Nada:
0s - 31s verse 1 (instrumental)
32s - 63s chorus 1(instrumental)
64s - 95s verse 2 (vocal)
96s - 126s chorus 2 (vocal)
127s - 143s chorus 3 (instrumental)
144s - 164s chorus 3 (vocal)
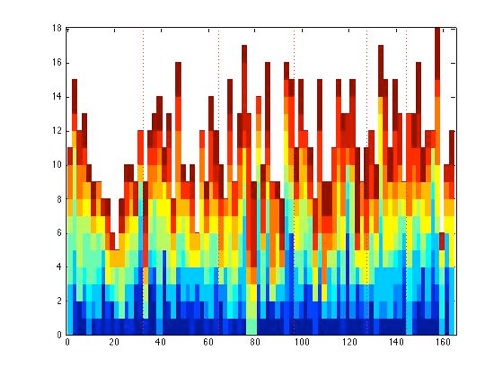
Song 3 (La Cumparsita):
Dancing Alone:
Dancing with Partner:
The dancing alone condition shows high arousal around the middle of chorus 1 and the start of verse 2. The dancing with partner has two highest areas of arousal, one around verse 2 and one around chorus 3.
For reference, here’s the musical structure of La Cumparsita:
0s - 27s verse 1 (instrumental)
28s - 55s chorus 1(instrumental)
56s - 83s verse 2 (instrumental)
84s - 111s chorus 2 (instrumental)
112s - 144s chorus 3 (instrumental)
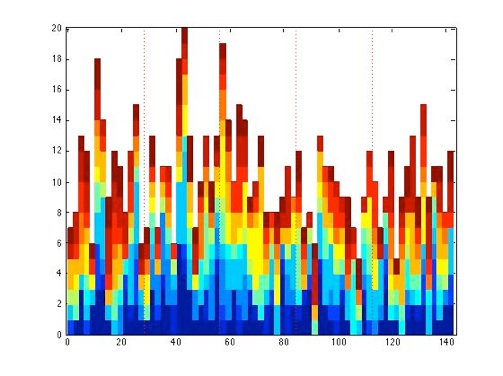
Song 4 (I Got...):
Dancing Alone:
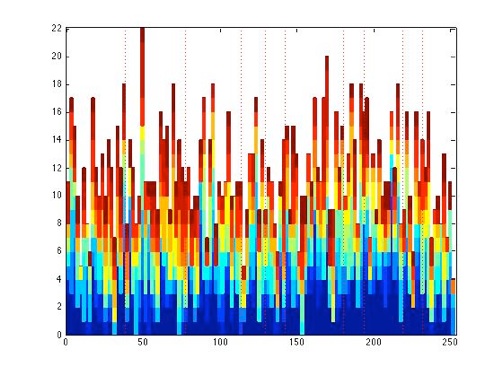
Dancing with Partner:
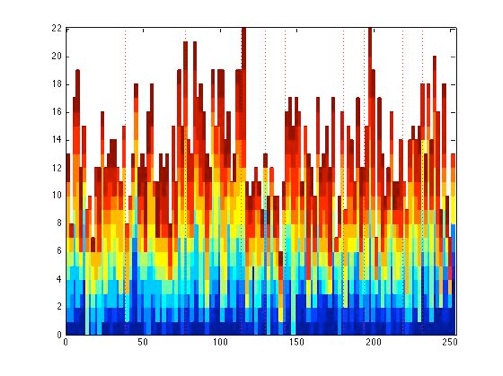
Both conditions reflect the energy structure of the song, which is a bimodal distribution around the first full chorus (77s-112s) and the second full chorus(180s-192s). In addition, both conditions have low peak counts during the second verse(129s-142s), the area of lowest energy in the song. In particular, the dancing with partner condition clearly reflects the energy build up of the song to the first full chorus (77-112s).
For reference, here’s the musical structure of I Got... (this one is more complicated).
0s - 38s verse 1
38s - 76s build up to chorus 1
77s - 112s full chorus 1 (highest energy)
113s - 128s alternative chorus 1
129s - 142s verse 2 (calm)
142s - 180s build-up to chorus 2(dramatic pause at 152s)
180s - 192s full chorus 2
193s - 217s alternative chorus 2
218s - 230s full chorus 3
231s - 252s verse 3(calm)
Conclusion:
One consistent trend from both conditions is a bimodal distribution of high peak count, one around the middle of the song and one around the last section. This is especially clear in the dancing with partner condition. One possible explanation for this is that composers generally build up tension up to the middle of the song, and again towards the end of the song. The reflection of energy levels in the song is especially clear in song 4, possibly because it is especially designed to have very clear areas of energy build up and dissipation. These results remind me of Teresa Nakra’s work on conductor-audience correlation, in particular the part where she finds clear differences in the conductor’s physiological signals against different sections of the score (Nakra & BuSha).
Note that there isn’t necessary a correlation between peak onset times dancing alone while dancing with a partner. After all, music perception could be very different in the two conditions. As one participant told me after the experiment, they did not realize that song 4 in the dancing alone section was the same as song 4 in the dancing with partner section. The effect of different tasks on music perception (specifically, dancing alone vs. with partner) is a very interesting issue that awaits further study.
Dancing Alone vs. With Partner
According to Murcia et al., people reported the greater positive affect and cortisol decrease while dancing with a partner than alone (Murcia et al., 2009). What does the EDA data show?
1) Frequency of Peaks
In almost every case, there is a greater frequency of peaks in the dancing with partner section, which is associated with greater arousal.
2) Baseline Regression
The baseline is not always greater in the dancing with partner section. For 2 of the leaders, dancing with a partner is actually associated with a decrease in EDA baseline. In contrast, there is a greater tendency for increase EDA baseline for the followers (only 1 out of 5 followers had a decrease in baseline arousal). Perhaps dancing for followers is more continually arousing because the follower always needs to be attentive to the leader and make split-second decisions.
3) Average Level
In terms of average EDA levels, the dancing with partner condition corresponds to higher average EDA levels for all the followers and 4 out of the 7 leaders. For the other 3 leaders, the average arousal level while dancing alone is higher than dancing with a partner.
Conclusion:
Unfortunately, it’s difficult to make a conclusive claim that dancing with a partner is more arousing than dancing alone, because in this experiment the dancing with partner condition always comes after the dancing alone condition. In order to make that claim, I would need to randomize the order of the two dance conditions.
Song Familiarity
One of the factors I wanted to test is whether song familiarity makes a difference in the dancers’ EDA, i.e. is there a difference between song 3, which everyone is very familiar with, and song 4, which 10 out of the 12 people have never heard before?
1) Frequency of Peaks
Using the findpeaks function in matlab, I compared the difference in peak count rate between song 4 (unfamiliar song) and song 3 (very familiar song) in both dance conditions
In the dancing alone condition, the average in peak count/min difference (song 4 - song 3) is 2.8289 with a standard deviation of 8.6352.
In the dancing with partner condition, the average in peak count/min difference (song 4 - song 3) is 2.0317 with a standard deviation of 11.3172.
2) Average EDA and Baseline Regression
I chose not to look at the average EDA level and regression because song 4 could have higher baseline EDA for reasons other than the novelty of the song. For instance, it is possible that the average EDA level for song 4 is higher because it is the last song in the set.
Conclusion:
Just based on the frequency of peaks, it is inconclusive whether song familiarity is correlated with EDA levels. Another experiment where the order of songs 3 and 4 are randomized is needed in order to test the idea.