Stories

Couple #1:
Leader: 2+ years experience (light blue)
Follower: 2+ years experience (dark blue)
For the following graph and all the other graphs below:
* first marker = start of walking warm-up
* first gray area = dancing alone
-
*second gray area = dancing with partner
-
*each marker in a gray area indicates song transition
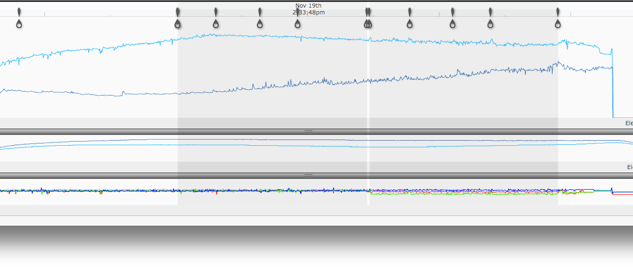
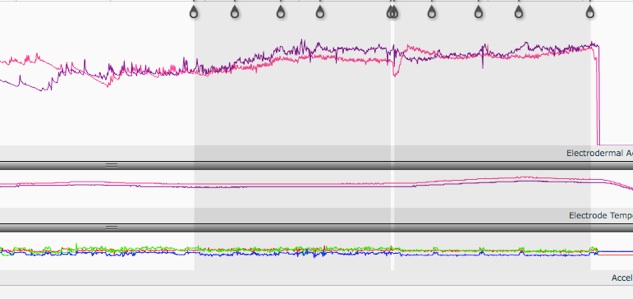
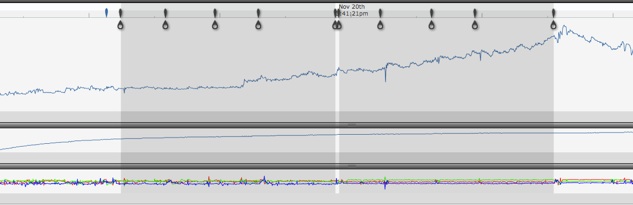
Leader’s song preference ratings (1=hate it, 10=love it): [5 5 8 10]
Follower’s song preference ratings: [5 6 7 10]
The leader has fairly stable EDA with a slightly downward trend once the dancing alone section started. A visual inspection shows greater peak frequency and amplitude in the dancing with partner section, compared to dancing alone.
The follower has a slight upwards trend throughout, but flattens during song 4 in the dancing with partner section. Peaks start increasing in frequency in the dancing alone section starting from song 2. In general, the peak frequency is greater in the dancing with partners section.
Couple #2:
Leader: 5+ years experience (light blue)
Follower: 2+ years experience (dark blue)
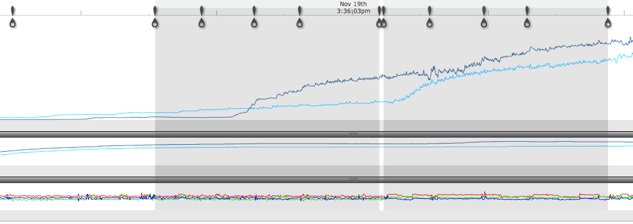
Leader’s song preference ratings: [10 9 8 9]
Follower’s song preference ratings: [10 9 8 8]
The leader’s EDA signal has a very slow ramp up during the warm-up and dancing alone section, but quickly increases in both amplitude and peak frequency during the dancing with partner section.
The follower’s EDA signal starts increasing rapidly in the middle of song 2 during the dancing alone section. In the dancing alone section, peak frequency is greater in song 4 than song 3. Peak frequency continues at roughly the same rate during the dancing with partner section.
Let’s pause for a moment.
Even with just two couples, we can already see how different the responses are. The leader from couple 1 has a general downward trend in EDA in the dancing with partner section, while the leader from couple 2 has an upward trend. The leaders have greater frequency of peaks during the dancing with partner section. The followers start having greater frequency of peaks starting from song 3 in the dancing alone section. Note that couple #1’s signal remains relatively stable after the warm-up, while the warm-up section had roughly no effect on the EDA levels of couple #2.
Couple #3:
Leader: 5+ years experience (dark blue)
Follower: 5+ years experience (light)
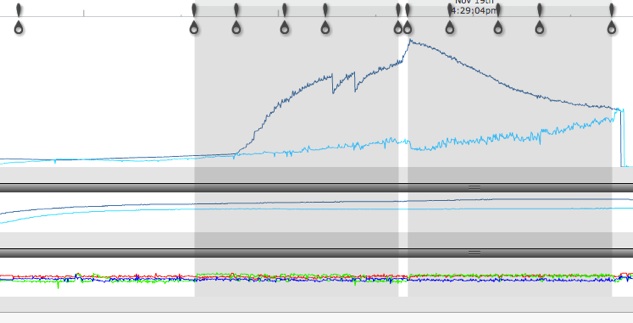
Leader’s song preference ratings (1=hate it, 10=love it): [9 8 7 5]
Follower’s song preference ratings: [6.5 8 7 2.5]
Like couple #2, the warm-up section has no effect on the dancers’ EDA. The leader’s EDA quickly ramps up starting from song #2 in the dancing alone section. (The two dips during song #4 are due to wrist strap re-adjustment). During the dancing with partner section, the leader’s EDA begins decreasing. (Note how this is completely different from the leader’s response in couple #2, even though they are both experienced leaders!) The amplitude of the peaks also becomes much smaller during the dancing with partner section.
Unlike the leader, the follower’s EDA remains relatively stable during the dancing alone section. The frequency of peaks for the follower is greater in the dancing with partner section than dancing alone section.
Couple #4:
Leader: 2+ years (purple)
Follower: 2+ years (magenta)
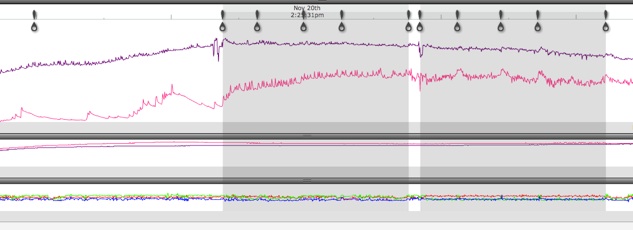
Leader’s song preference ratings (1=hate it, 10=love it): [6 7 6 7.5]
Follower’s song preference ratings: [7 9 7 7 ]
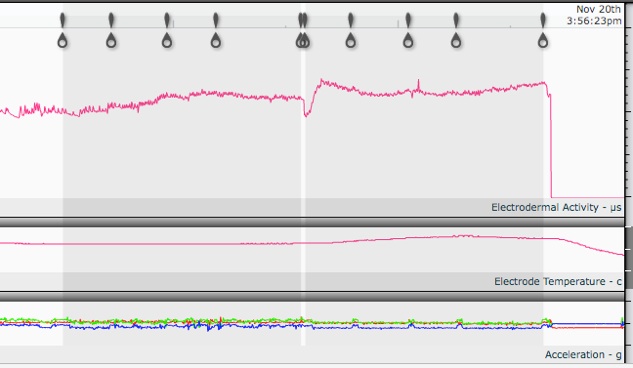
The leader’s EDA signal is similar to the leader in couple #1, where the signal slowly decreases over the two dance sections. The average peak frequency is slightly higher for the dancing with partner section than the dancing alone section.
The follower’s EDA baseline increases during the dancing alone section, then decreases slowly during the dancing with partner section (in contrast, most followers in this study have increasing baselines during the dancing with partner section). The frequency of peaks is greater in the dancing with partner section than the dancing alone section. There are also significant peaks at the beginning of each song in the dancing with partner section. Some possible explanations could be the movement of the sensor arm during transition time (the arm is fairly stationary while dancing) or change in mental state due to separation from the embrace.
Couple #5:
Leader: 2+ years (magenta)
Follower: 5+ years (purple)
Follower’s song preference ratings: [7 9 7 9]
Since the two signals have similar amplitudes, I’ll show each signal individually.
Leader’s EDA only:
The leader’s EDA has a slight increase during the first two songs of the dancing alone section, then flattens out during the last two songs. It’s hard say whether EDA is higher in the dancing with partner section because the sensor is re-adjusted in between sections (note the vertical drop in EDA). During the dancing with partner section, EDA baseline is fairly stable during songs 2 and 3, with a slightly upwards shift during song 4. The frequency of peaks is greater in the dancing alone section than dancing with partner section.
Follower’s EDA only:
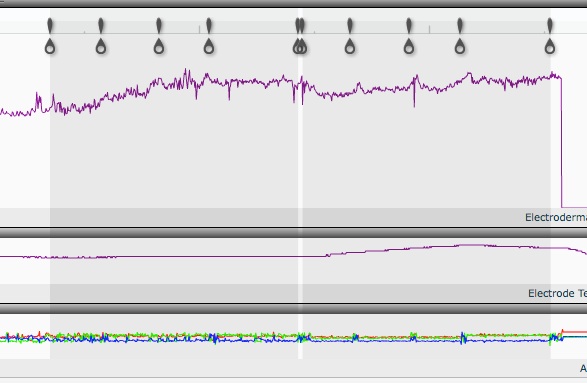
Like the leader’s EDA baseline, the follower’s EDA baseline also increases during the first two songs of the dancing alone section, then flattens during the last two songs. There’s a slight upwards trend in the dancing with partner section, ending with a fairly flat baseline during song 4. Like the follower in couple #4, there are also significant peaks at the beginning of each song.
The frequency of peaks is roughly equal during the two sections.
-
*Note that I didn’t include the follower information for couple #6 and #7 since I was dancing with the leaders. It is still interesting to look at just the leaders’ EDA.
Couple #6:
Leader: 5+ years (dark blue)
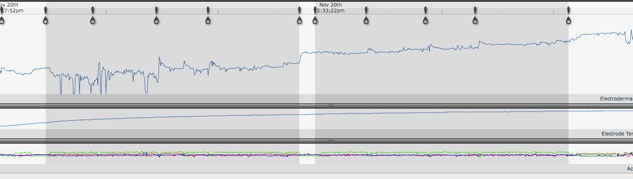
The leader’s sensor has some skin contact issues during the first two songs of the dancing alone section, after which the EDA signal remains fairly stable. There is a sharp increase in the transition between dancing alone and with partner, but it stabilizes quickly (the sharp increase happens right after I announce it’s time to dance with a partner). It is interesting to note the peaks at the beginning of the songs in both sections (most of the time this has been more obvious in followers!)
Couple #7:
Leader: 2+ years (dark blue)
The leader’s EDA begins increasing in the middle of song 3 in the dancing alone section, and continues to increase in the dancing with partner section. There is an increase in the frequency of peaks in the dancing with partner section.
Incidentally, the increase in the middle of song 3 happens when the leader starts thinking about which other versions of song 3 he has heard by different orchestras. This could be cognitive load at work.
I was originally only going to present generalized results, but the EDA responses, like dance styles, are so individualized that we would miss out on great stories if everything was generalized. I present here the EDA responses for all the subjects, each with a short interpretation, to share the uniqueness of everyone’s response.
To further preserve anonymity, only experience categories of 2+ or 5+ years are used.