Data Analysis
(What’s in a EDA Signal?)

Data Analysis
(What’s in a EDA Signal?)
Analyzing “Arousal”
Electrodermal activity (EDA) is a measure of sweat excreted by the eccrine glands, which is connected to the sympathetic nervous system (Goodall, 1970; Dawson et al., 2000). It is mostly commonly associated with changes in sympathetic arousal. It is important to note that EDA is not correlated with valence; both positive and negative affect can alter sympathetic arousal (Lang et al., 1998).
EDA signals are tricky to analyze because they have multiple components, and because multiple factors can trigger changes in EDA.
1) Factors that alter EDA
Changes in EDA are most commonly associated with changes in sympathetic arousal. However, factors that cause increased sweat production, such as humidity, room temperature, and physical exertion, can also cause increased EDA. Furthermore, mental exertion can increase EDA as well (Pugh et al., 1966).
In the context of tango dancing, factors that can alter EDA include physical exertion from movement; cognitive load from music interpretation, response to partner, floorcraft, and choice of the next step; and arousal from music perception and physical proximity to partner.
2) Peaks vs. Baseline
EDA signals can be separated into low-frequency and high-frequency components.
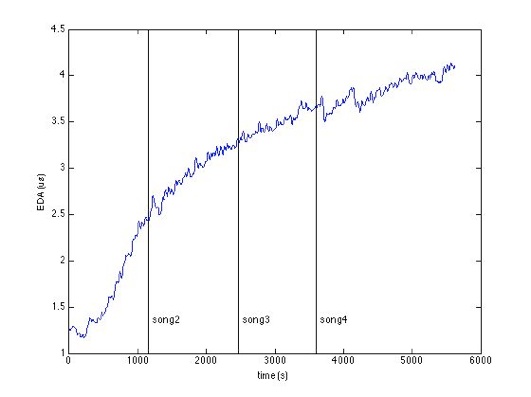
The low-frequency component (the baseline) accounts for the general shape of the signal. For instance, in the chart above, the baseline increases over time. The rate of increase/decrease of the baseline can give a sense of how arousing an activity is.
The high-frequency component accounts for the individual peaks that occur in the signal. The density of peaks and the peak onset times are also associated with sympathetic arousal. For instance, in the chart above, the frequency of peaks is higher in song 2 than song 1.