Voronoi Diagram Tutorial
by jacobsj
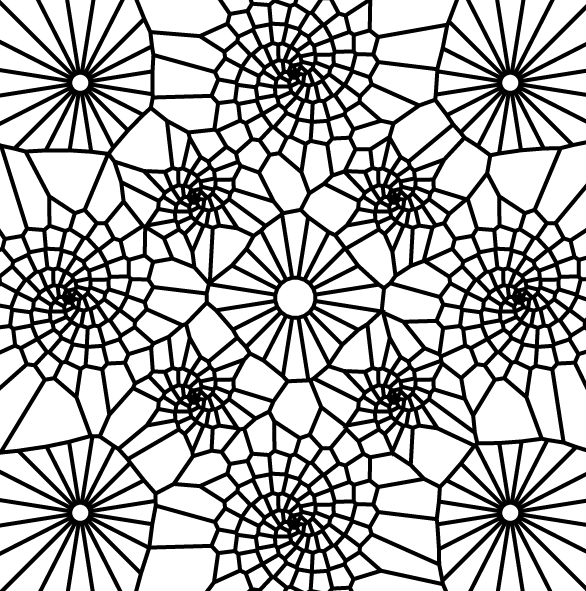
A voronoi diagram is a planar graph that has unique properties.The diagram consists of the partitioning of a plane with points into convex polygons such that each polygon contains exactly generating point and every point in a given polygon is closer to its generating point than to any other.
Voronoi diagrams are very efficient ways of creating a subdivision of space and have many uses in a variety of fields including robotics, chemistry, engineering and computer science. They are also encountered in many natural structures.
Most importantly though, they look cool and can be used to make beautiful patterns!
You can use Processing to generate and control voronoi diagrams, and export the resulting structures as vector files. Follow these steps:
- Download and install processing, available here
- Download the voronoi example code here: final_code_examples.zip
- Unzip the file, and copy all of the directories in “sketches” to your Processing directory that was automatically created when you installed processing. This directory is usually located in your Documents folder.
- Copy the directory in the libraries folder into the Processing/libraries folder. If the libraries folder does not exist, manually create it first. This is where you will place external libraries in the future that add additional functionality to your code.
The code contains 5 separate sketches that illustrate varying approaches to creating ordered / unordered sets of points to generate voronoi diagrams. Each sketch consists of the same basic structure:
- A setup function that contains all of the code
- A method that intializes the Voronoi generator (setupVoronoi())
- A recording method that allows you to save your file as a vector pdf (beginRaw())
- A rendering method that draws the voronoi diagram (drawVoronoi())
- Each sketch also contains a voronoi_generator.pde file that consists of the code that renders the voronoi diagram itself. YOU DO NOT NEED TO MODIFY THIS CODE.
The specifics of the different sketches are outlined below:
- random.pde: Generate a random set of points to create your diagram
- grid_voronoi.pde: Use a loop to generate a regular grid of points
- simple_circle.pde: Use a loop to generate points that describe a circle
- simple_spiral.pde: Use a loop to increment the radius of your circle, resulting in a spiral of points
- simple_spiral_circle.pde: Generate a combination of multiple spirals and circles
Experiment with modifying any of these sketches to get a wide variety of patterns and effects!
Once you execute your code, it will save a pdf of your design to the corresponding sketch folder in your Processing directory. At this point, you will need to modify your design a bit in adobe illustrator to prep it for the laser cutter.
These steps are as follows:
1. Open the pdf in illustrator
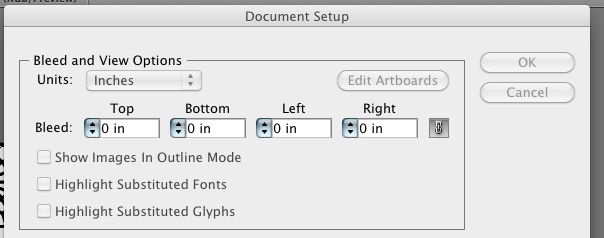
2. Go to File->Document Setup and switch the units of your file to inches or centimeters, whichever you prefer
3. Click on the artboard selector in the tools and check the size of your artboard. Make sure it is the correct dimensions, and resize it if necessary. If you resize the artboard, select the black arrow, click on your diagram and resize it to fit the artboard.
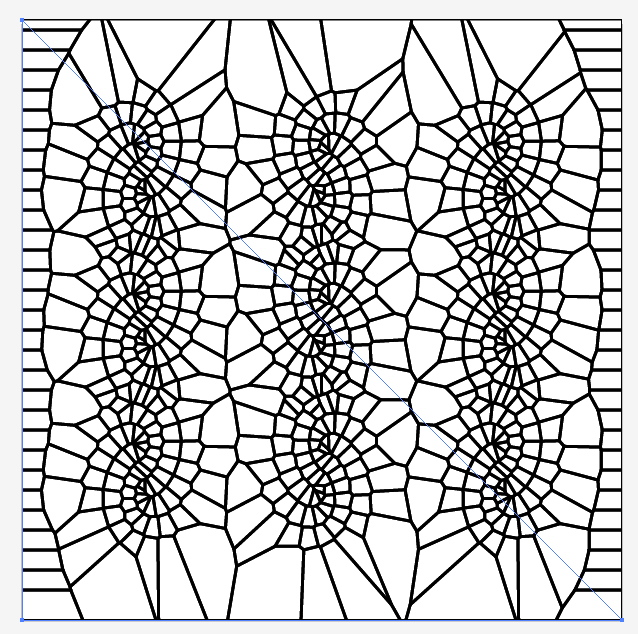
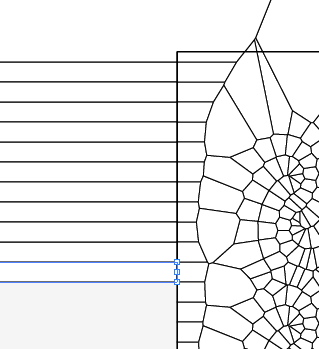
4.Select your whole diagram and set the stroke color to black and the fill to none. Set the stroke weight to the desired width of your lines. Remember that if you select a weight that is too thin for your material, the laser will burn the pattern away. Between 3 and 8 pt is a good range. Select the white arrow and select and delete the two large triangle artifacts in the middle of your diagram. If not deleted, these will add undesirable lines to your diagram when you merge all the paths.
4. Right click on your diagram and select “Release Clipping Mask”.
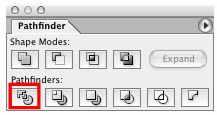
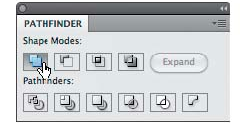
5. Open the pathfinder toolbox by going to Window->Pathfinder. Ensure that your fill is set to none and select your whole diagram again and then select the divide option on the pathfinder box.
6. Ungroup your object by selecting it and going to Object->Ungroup. Select your diagram again and select all of the shapes outside of the clipping mask and delete them. You may have to use the white arrow to select one initially, but you should be able to select large numbers of them simultaneously of them by drawing a box around them with the black arrow and hitting delete.
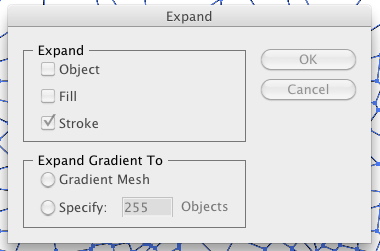
7. Select all of the remaining objects in your cleaned up diagram and go to Object->Expand. Select “stroke” and hit ok.
8. Lastly, Select the whole diagram, go back to your pathfinder window and select “Unite”. This will merge all of your paths into one. Save your file as a pdf and you’re ready to cut!
Slides from the tutorial are here: presentation.pdf
Some external links that may be of some use/Inspiration:
http://www.shiffman.net/teaching/nature/
http://www.shiffman.net/teaching/nature/week7/
http://blog.blprnt.com/blog/blprnt/7-days-of-source-day-3-tree-growth
http://processing.org/reference/
http://mcleodbutterflies.com/families/
Sine wave code: sinwave_voronoi.zip